

Question: The table below contains data on Fincorp Inc. The balance sheet items correspond to values at year-end 2015 and 2016, while the income statement items
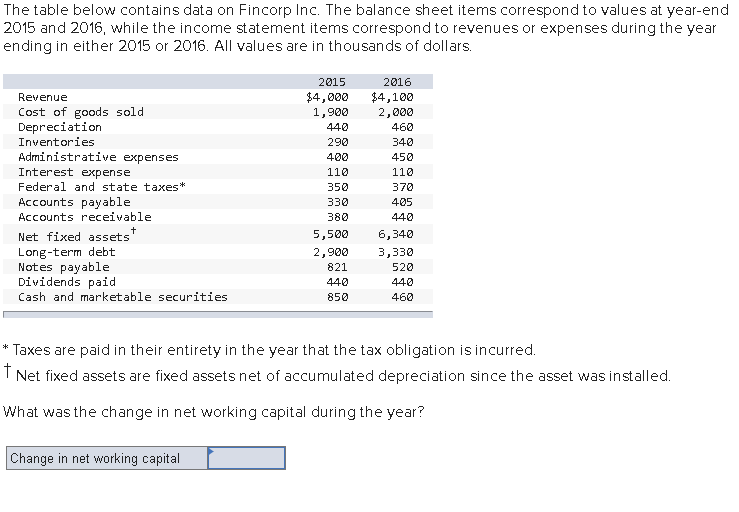
The table below contains data on Fincorp Inc. The balance sheet items correspond to values at year-end 2015 and 2016, while the income statement items correspond to revenues or expenses during the year ending in either 2015 or 2016. All values are in thousands of dollars 2016 $4,000$4,100 1,900 2,000 460 340 450 110 370 405 440 5,500 6,340 2,900 3,330 520 440 460 2015 Revenue Cost of goods sold Depreciation Inventories Administrative expenses Interest expense Federal and state taxes* Accounts payable Accounts receivable 440 290 400 110 350 330 380 Net fixed assets Long-term debt Notes pavable Dividends paid Cash and marketable securities 821 440 850 * Taxes are paid in their entirety in the year that the tax obligation is incurred Net fixed assets are fixed assets net of accumulated depreciation since the asset was installed What was the change in net working capital during the year? Change in net working capital
Step by Step Solution
There are 3 Steps involved in it

Get step-by-step solutions from verified subject matter experts