

Question: The table below gives example data on monthly means, variances and covariances for the returns on Microsoft, Nordstrom and Starbucks (assets A, B and C)
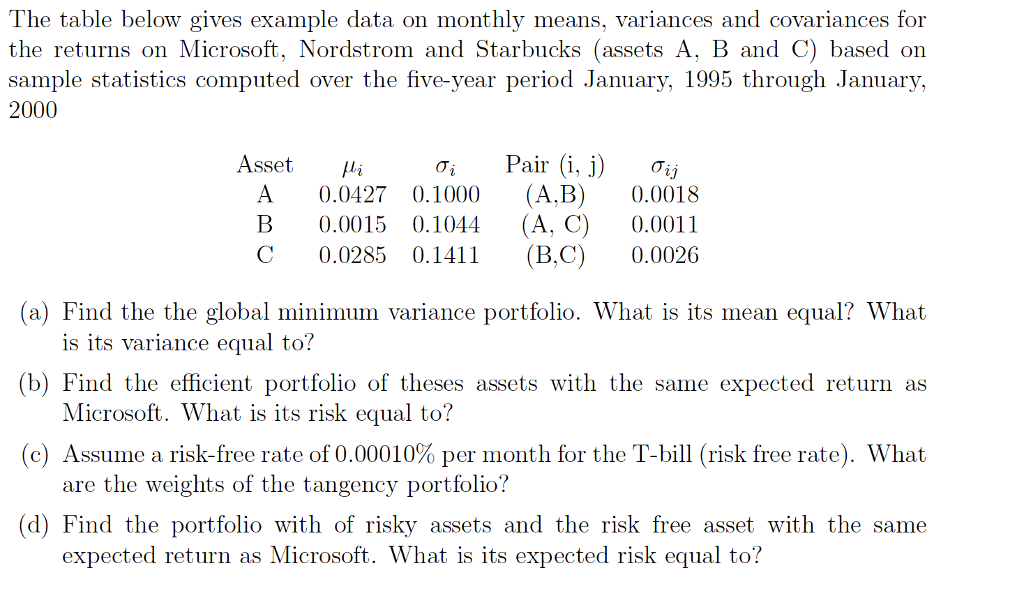
The table below gives example data on monthly means, variances and covariances for the returns on Microsoft, Nordstrom and Starbucks (assets A, B and C) based on sample statistics computed over the five-year period January, 1995 through January, 2000 Asset ,li 4 i Pair (i,j) j A 0.0427 0.1000 (A,B) 0.0018 B 0.0015 0.1044 (A. C) 0.0011 C 0.0285 0.141 (B,C) 0.0026 (a) Find the the global minimum variance portfolio. What is its mean equal? What (b) Find the efficient portfolio of theses assets with the same expected return as (c) Assume a risk-free rate of 0.00010% per month for the T-bill (risk free rate). What (d) Find the portfolio with of risky assets and the risk free asset with the same is its variance equal to? Microsoft. What is its risk equal to? are the weights of the tangency portfolio? expected return as Microsoft. What is its expected risk equal to? The table below gives example data on monthly means, variances and covariances for the returns on Microsoft, Nordstrom and Starbucks (assets A, B and C) based on sample statistics computed over the five-year period January, 1995 through January, 2000 Asset ,li 4 i Pair (i,j) j A 0.0427 0.1000 (A,B) 0.0018 B 0.0015 0.1044 (A. C) 0.0011 C 0.0285 0.141 (B,C) 0.0026 (a) Find the the global minimum variance portfolio. What is its mean equal? What (b) Find the efficient portfolio of theses assets with the same expected return as (c) Assume a risk-free rate of 0.00010% per month for the T-bill (risk free rate). What (d) Find the portfolio with of risky assets and the risk free asset with the same is its variance equal to? Microsoft. What is its risk equal to? are the weights of the tangency portfolio? expected return as Microsoft. What is its expected risk equal to
Step by Step Solution
There are 3 Steps involved in it

Get step-by-step solutions from verified subject matter experts