

Question: The table below gives statistics relating to two stocks. Mean Annual Standard Deviation Return (%) of Return (%) Skewness Excess Kurtosis 11.5 5.5 Stock A
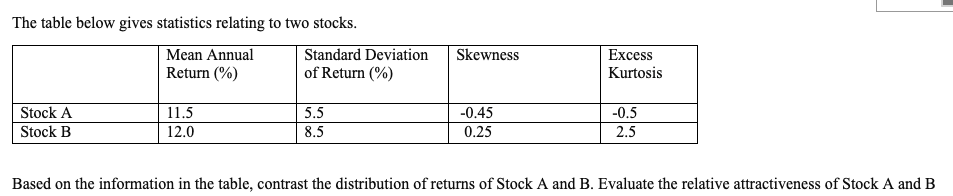
The table below gives statistics relating to two stocks. Mean Annual Standard Deviation Return (%) of Return (%) Skewness Excess Kurtosis 11.5 5.5 Stock A Stock B -0.5 2.5 12.0 -0.45 0.25 8.5 Based on the information in the table, contrast the distribution of returns of Stock A and B. Evaluate the relative attractiveness of Stock A and B
Step by Step Solution
There are 3 Steps involved in it
1 Expert Approved Answer
Step: 1 Unlock

Question Has Been Solved by an Expert!
Get step-by-step solutions from verified subject matter experts
Step: 2 Unlock
Step: 3 Unlock