

Question: The table below gives students' grades on a math test. Grades Frequency A 18 B 14 C 9 6 F 3 A. Create a
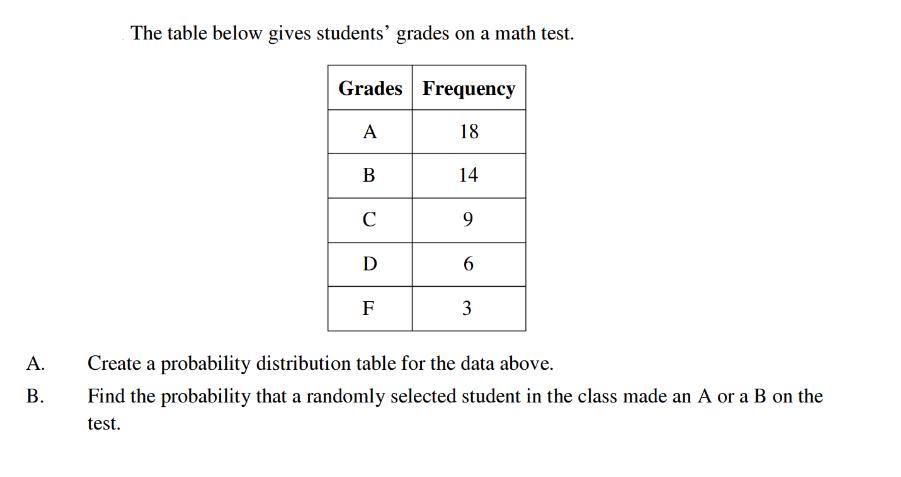
The table below gives students' grades on a math test. Grades Frequency A 18 B 14 C 9 6 F 3 A. Create a probability distribution table for the data above. AR B. Find the probability that a randomly selected student in the class made an A or a B on the test.
Step by Step Solution
There are 3 Steps involved in it
1 Expert Approved Answer
Step: 1 Unlock

A Probability distribution table Grade Frequency Probability A 18 1850 036 B 14 14... View full answer
Question Has Been Solved by an Expert!
Get step-by-step solutions from verified subject matter experts
Step: 2 Unlock
Step: 3 Unlock
Document Format (2 attachments)
661e7b1dbb32f_881287.pdf
180 KBs PDF File
661e7b1dbb32f_881287.docx
120 KBs Word File