

Question: The table below gives U.S. lead emissions, , into the environment in millions of metric tons for 1970-1992. Let =0 in 1970. For a and
The table below gives U.S. lead emissions, , into the environment in millions of metric tons for 1970-1992. Let =0 in 1970. For a and b, please provide the exact functions.
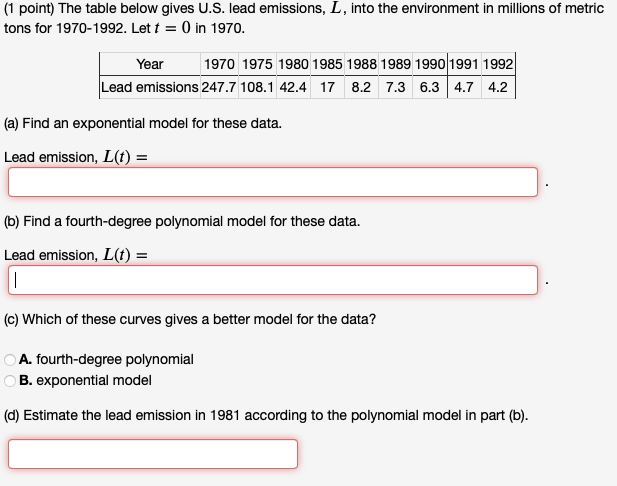
(1 point) The table below gives U.S. lead emissions, L, into the environment in millions of metric tons for 19701992. Let t=0 in 1970. (a) Find an exponential model for these data. Lead emission, L(t)= (b) Find a fourth-degree polynomial model for these data. Lead emission, L(t)= (c) Which of these curves gives a better model for the data? A. fourth-degree polynomial B. exponential model (d) Estimate the lead emission in 1981 according to the polynomial model in part (b)
Step by Step Solution
There are 3 Steps involved in it

Get step-by-step solutions from verified subject matter experts