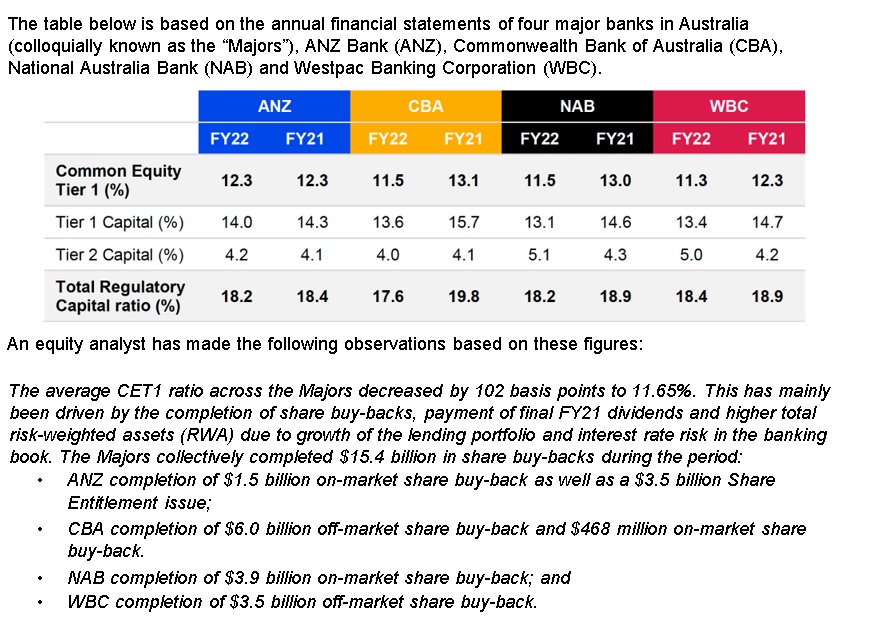
Question: The table below is based on the annual financial statements of four major banks in Australia (colloquially known as the Majors), ANZ Bank (ANZ), Commonwealth

The table below is based on the annual financial
The table below is based on the annual financial statements of four major banks in Australia (colloquially known as the "Majors"), ANZ Bank (ANZ), Commonwealth Bank of Australia (CBA), National Australia Bank (NAB) and Westpac Banking Corporation (WBC). ANZ CBA NAB WBC FY22 FY21 FY22 FY21 FY22 FY21 FY22 FY21 Common Equity Tier 1 (%) 12.3 12.3 11.5 13.1 11.5 13.0 11.3 12.3 Tier 1 Capital (%) 14.0 14.3 13.6 15.7 13.1 14.6 13.4 14.7 Tier 2 Capital (%) 4.2 4.1 4.0 4.1 5.1 4.3 5.0 4.2 Total Regulatory Capital ratio (%) 18.2 18.4 17.6 19.8 18.2 18.9 18.4 18.9 An equity analyst has made the following observations based on these figures: The average CET1 ratio across the Majors decreased by 102 basis points to 11.65%. This has mainly been driven by the completion of share buy-backs, payment of final FY21 dividends and higher total risk-weighted assets (RWA) due to growth of the lending portfolio and interest rate risk in the banking book. The Majors collectively completed $15.4 billion in share buy-backs during the period: ANZ completion of $1.5 billion on-market share buy-back as well as a $3.5 billion Share Entitlement issue; CBA completion of $6.0 billion off-market share buy-back and $468 million on-market share buy-back. NAB completion of $3.9 billion on-market share buy-back; and WBC completion of $3.5 billion off-market share buy-back

Step by Step Solution

There are 3 Steps involved in it

1 Expert Approved Answer
Step: 1 Unlock blur-text-image
Question Has Been Solved by an Expert!

Get step-by-step solutions from verified subject matter experts

Step: 2 Unlock
Step: 3 Unlock

Students Have Also Explored These Related Accounting Questions!