

Question: The table below lists observed frequencies for different variables and categories. Identify the expected frequencies in the cells labeled G, H, I, J. 20/20 vision
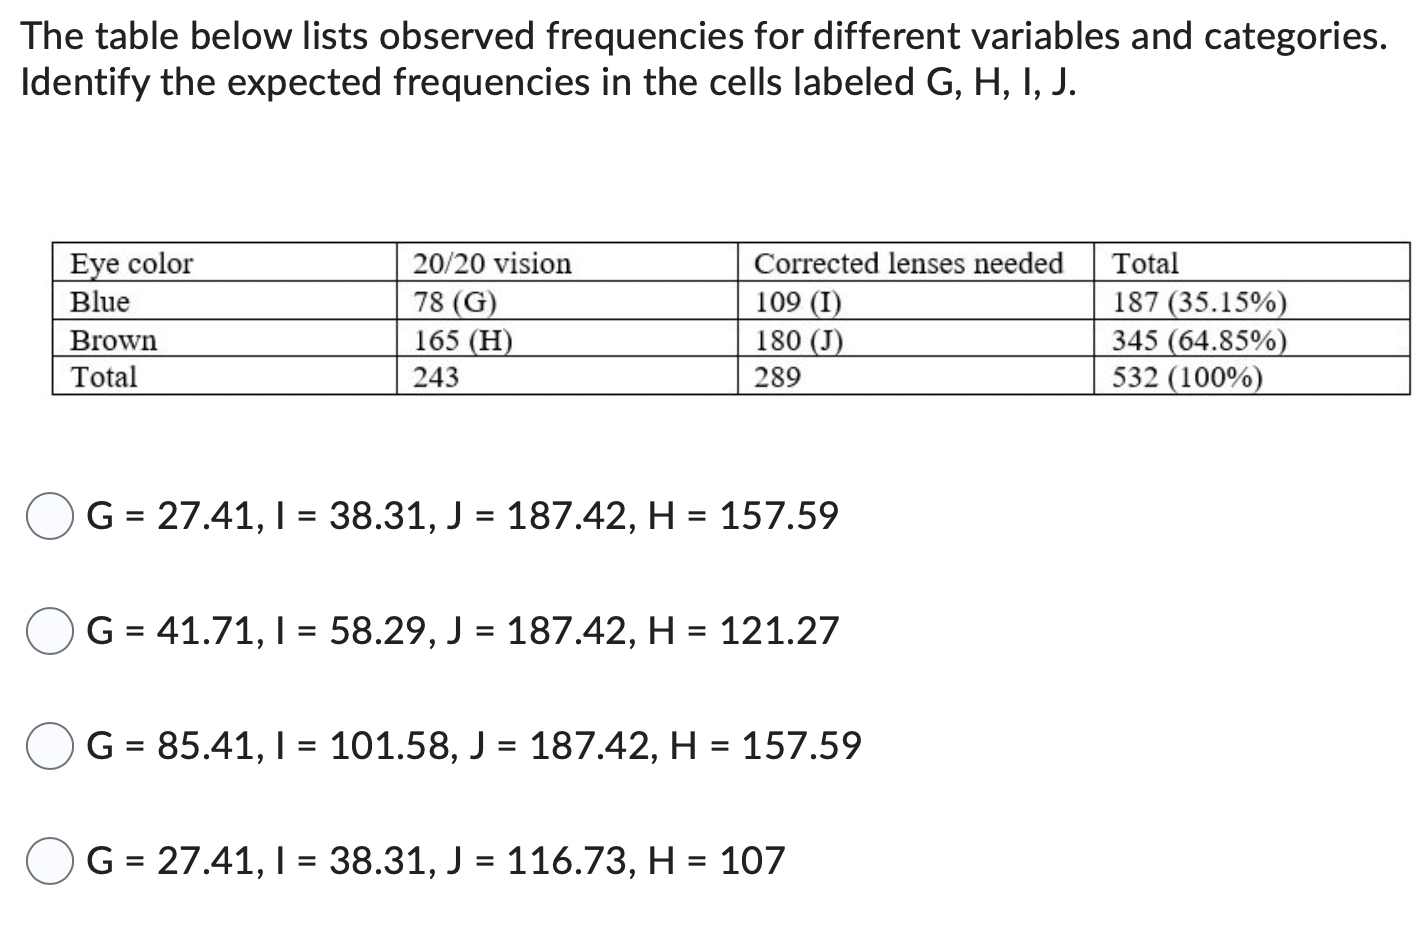
The table below lists observed frequencies for different variables and categories. Identify the expected frequencies in the cells labeled G, H, I, J. 20/20 vision Corrected lenses needed mm 187 35.15% 180 J 345 64.85% 532 100% Q G = 27.41, I = 3331.1 = 137.42, H = 157.59 0 G = 41.71, | = 5329.1 = 137.42, H = 121.27 0 G = 35.41, I = 101.53, J = 137.42, H = 157.59 0 G = 27.41, | = 38.31,J = 116.73, H = 107
Step by Step Solution
There are 3 Steps involved in it
1 Expert Approved Answer
Step: 1 Unlock

Question Has Been Solved by an Expert!
Get step-by-step solutions from verified subject matter experts
Step: 2 Unlock
Step: 3 Unlock