

Question: The table below lists rainfall data recorded at a USGS gauge for three storm events. ( a ) Plot the cumulative mass curve ( in
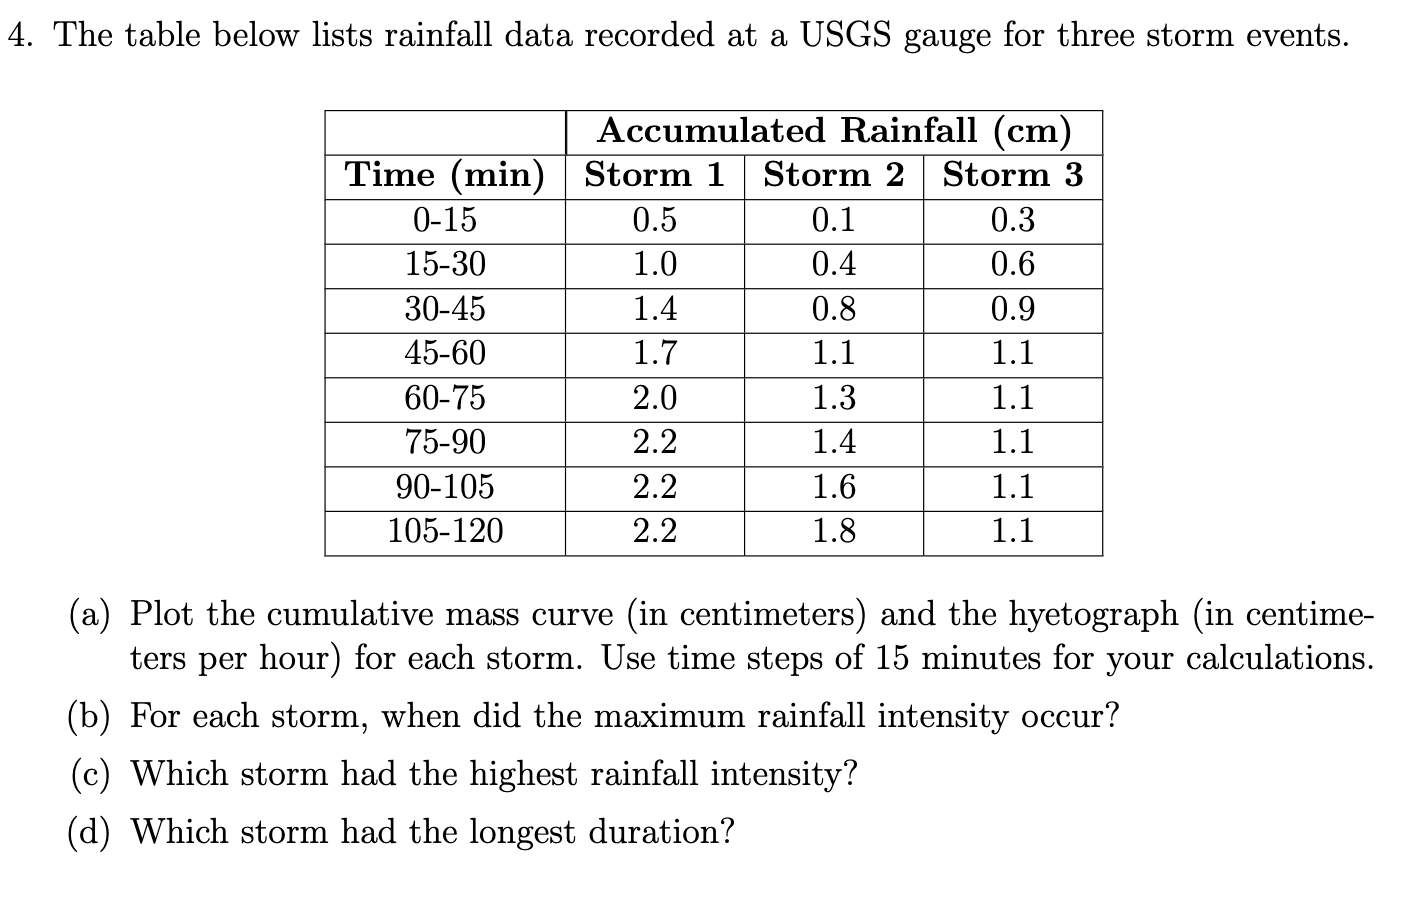
The table below lists rainfall data recorded at a USGS gauge for three storm events.
a Plot the cumulative mass curve in centimeters and the hyetograph in centime
ters per hour for each storm. Use time steps of minutes for your calculations.
b For each storm, when did the maximum rainfall intensity occur?
c Which storm had the highest rainfall intensity?
d Which storm had the longest duration?
Step by Step Solution
There are 3 Steps involved in it
1 Expert Approved Answer
Step: 1 Unlock

Question Has Been Solved by an Expert!
Get step-by-step solutions from verified subject matter experts
Step: 2 Unlock
Step: 3 Unlock