

Question: The table below lists the prices from last year and the base year for a college- related basket of goods. Assume that the typical
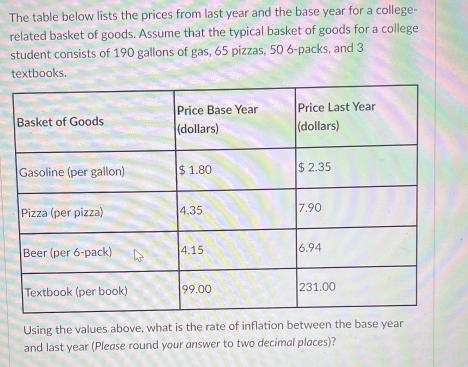
The table below lists the prices from last year and the base year for a college- related basket of goods. Assume that the typical basket of goods for a college student consists of 190 gallons of gas, 65 pizzas, 50 6-packs, and 3 textbooks. Price Base Year Basket of Goods (dollars) Price Last Year (dollars) Gasoline (per gallon) $1.80 $2.35 Pizza (per pizza) 4.35 7.90 Beer (per 6-pack) 4.15 6.94 Textbook (per book) 99.00 231.00 Using the values above, what is the rate of inflation between the base year. and last year (Please round your answer to two decimal places)?
Step by Step Solution
There are 3 Steps involved in it
To calculate the rate of inflation between the base ye... View full answer

Get step-by-step solutions from verified subject matter experts