

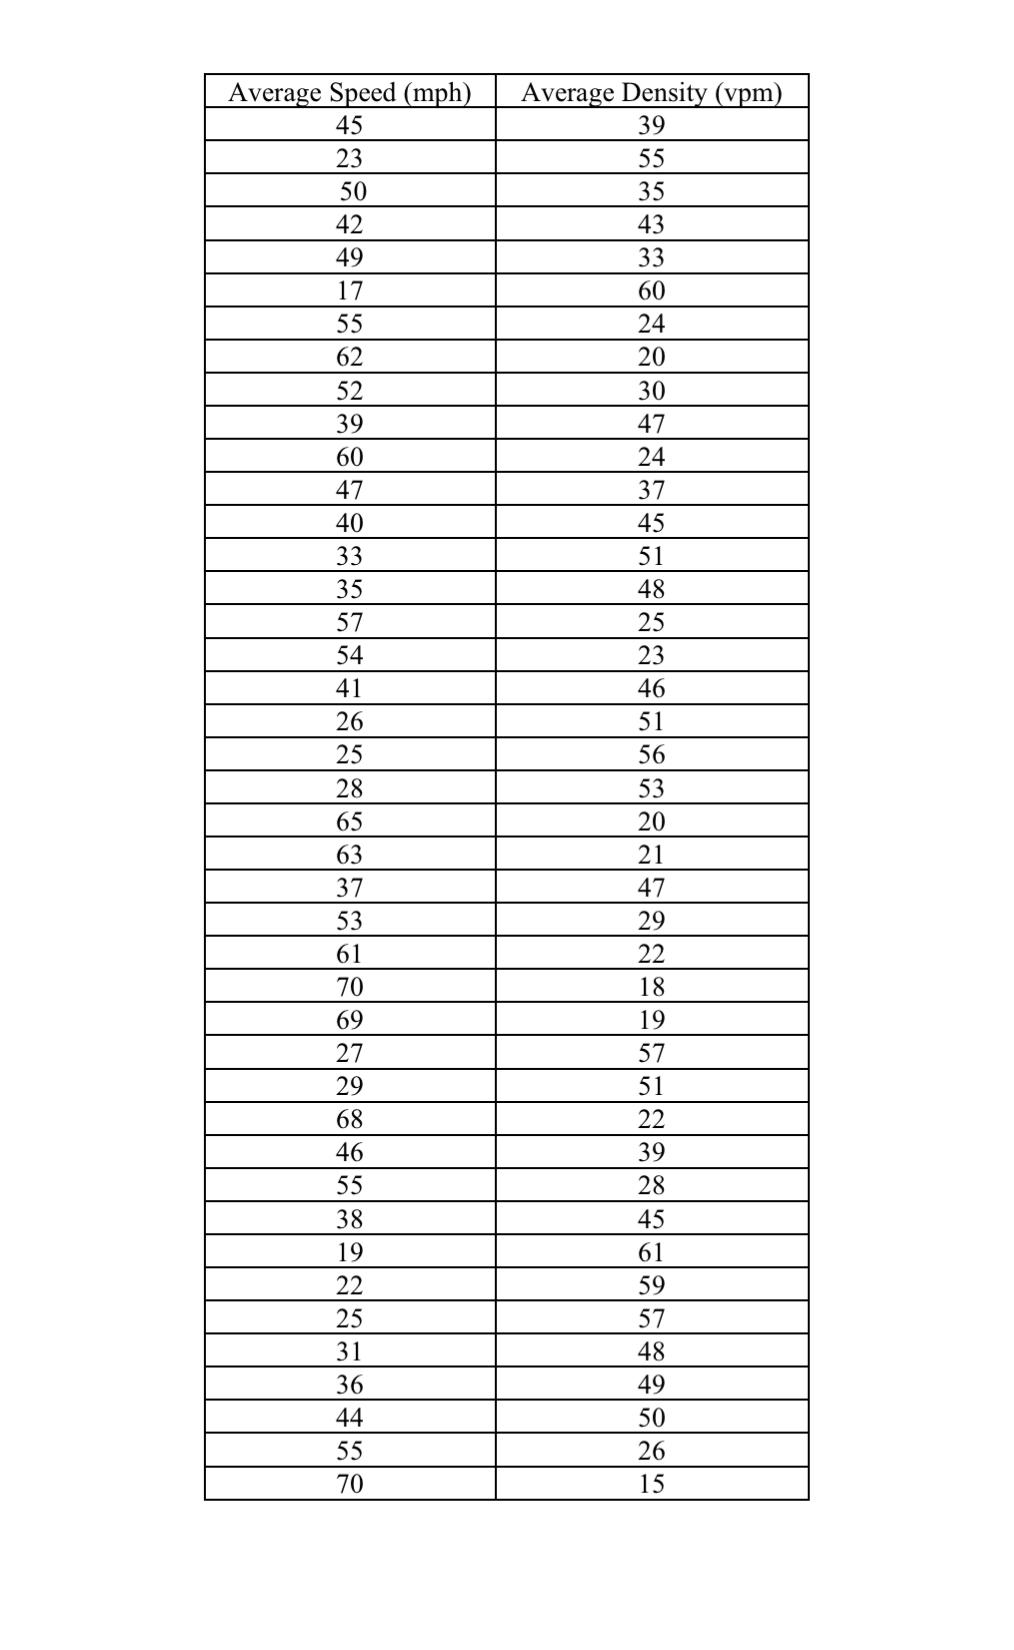
Question: The table below lists the speeds ( mph ) and densities ( vpm ) for an urban freeway. Use Excel to plot the three fundamental
The table below lists the speeds mph and densities vpm for an urban freeway. Use Excel to plot the three fundamental diagrams and use trend lines to show the relationshipbetween traffic flow, speed and density. From these diagrams, find the free flow speed FFS the jam density Dj and the maximum flow qmax Also, determine the average space headway and time headway at maximum flow condition.The results of this lab assignment in the forms of tables and figures should be uploaded toCanvas by the end of todays meeting
Step by Step Solution
There are 3 Steps involved in it
1 Expert Approved Answer
Step: 1 Unlock

Question Has Been Solved by an Expert!
Get step-by-step solutions from verified subject matter experts
Step: 2 Unlock
Step: 3 Unlock