

Question: The table below presents a probability distribution for the returns of two stocks. State Stock 1 Probability 0.2 Stock 2 8% 10% 0.2 13% Very
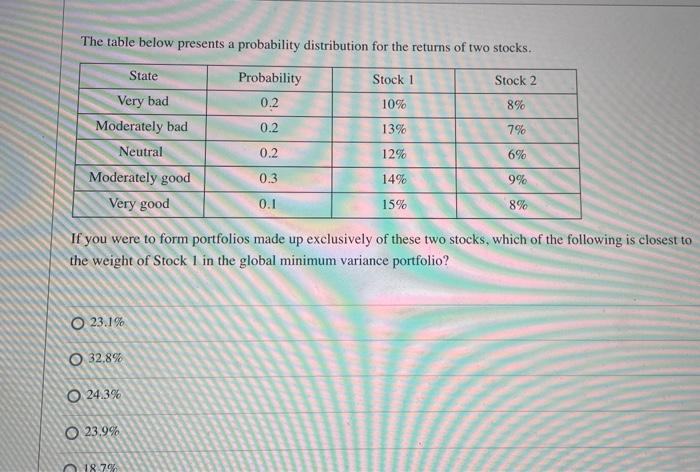
The table below presents a probability distribution for the returns of two stocks. State Stock 1 Probability 0.2 Stock 2 8% 10% 0.2 13% Very bad Moderately bad Neutral Moderately good Very good 7% 6% 12% 0.2 0.3 0.1 14% 9% 15% 8% If you were to form portfolios made up exclusively of these two stocks, which of the following is closest to the weight of Stock 1 in the global minimum variance portfolio? O 23.1% O 32.89 O 24.3% O 23.9% 18.7%
Step by Step Solution
There are 3 Steps involved in it
1 Expert Approved Answer
Step: 1 Unlock

Question Has Been Solved by an Expert!
Get step-by-step solutions from verified subject matter experts
Step: 2 Unlock
Step: 3 Unlock