

Question: The table below presents an experimental data for the urea concentrations altering in an enzymatic process with respect to time. table [ [ Time
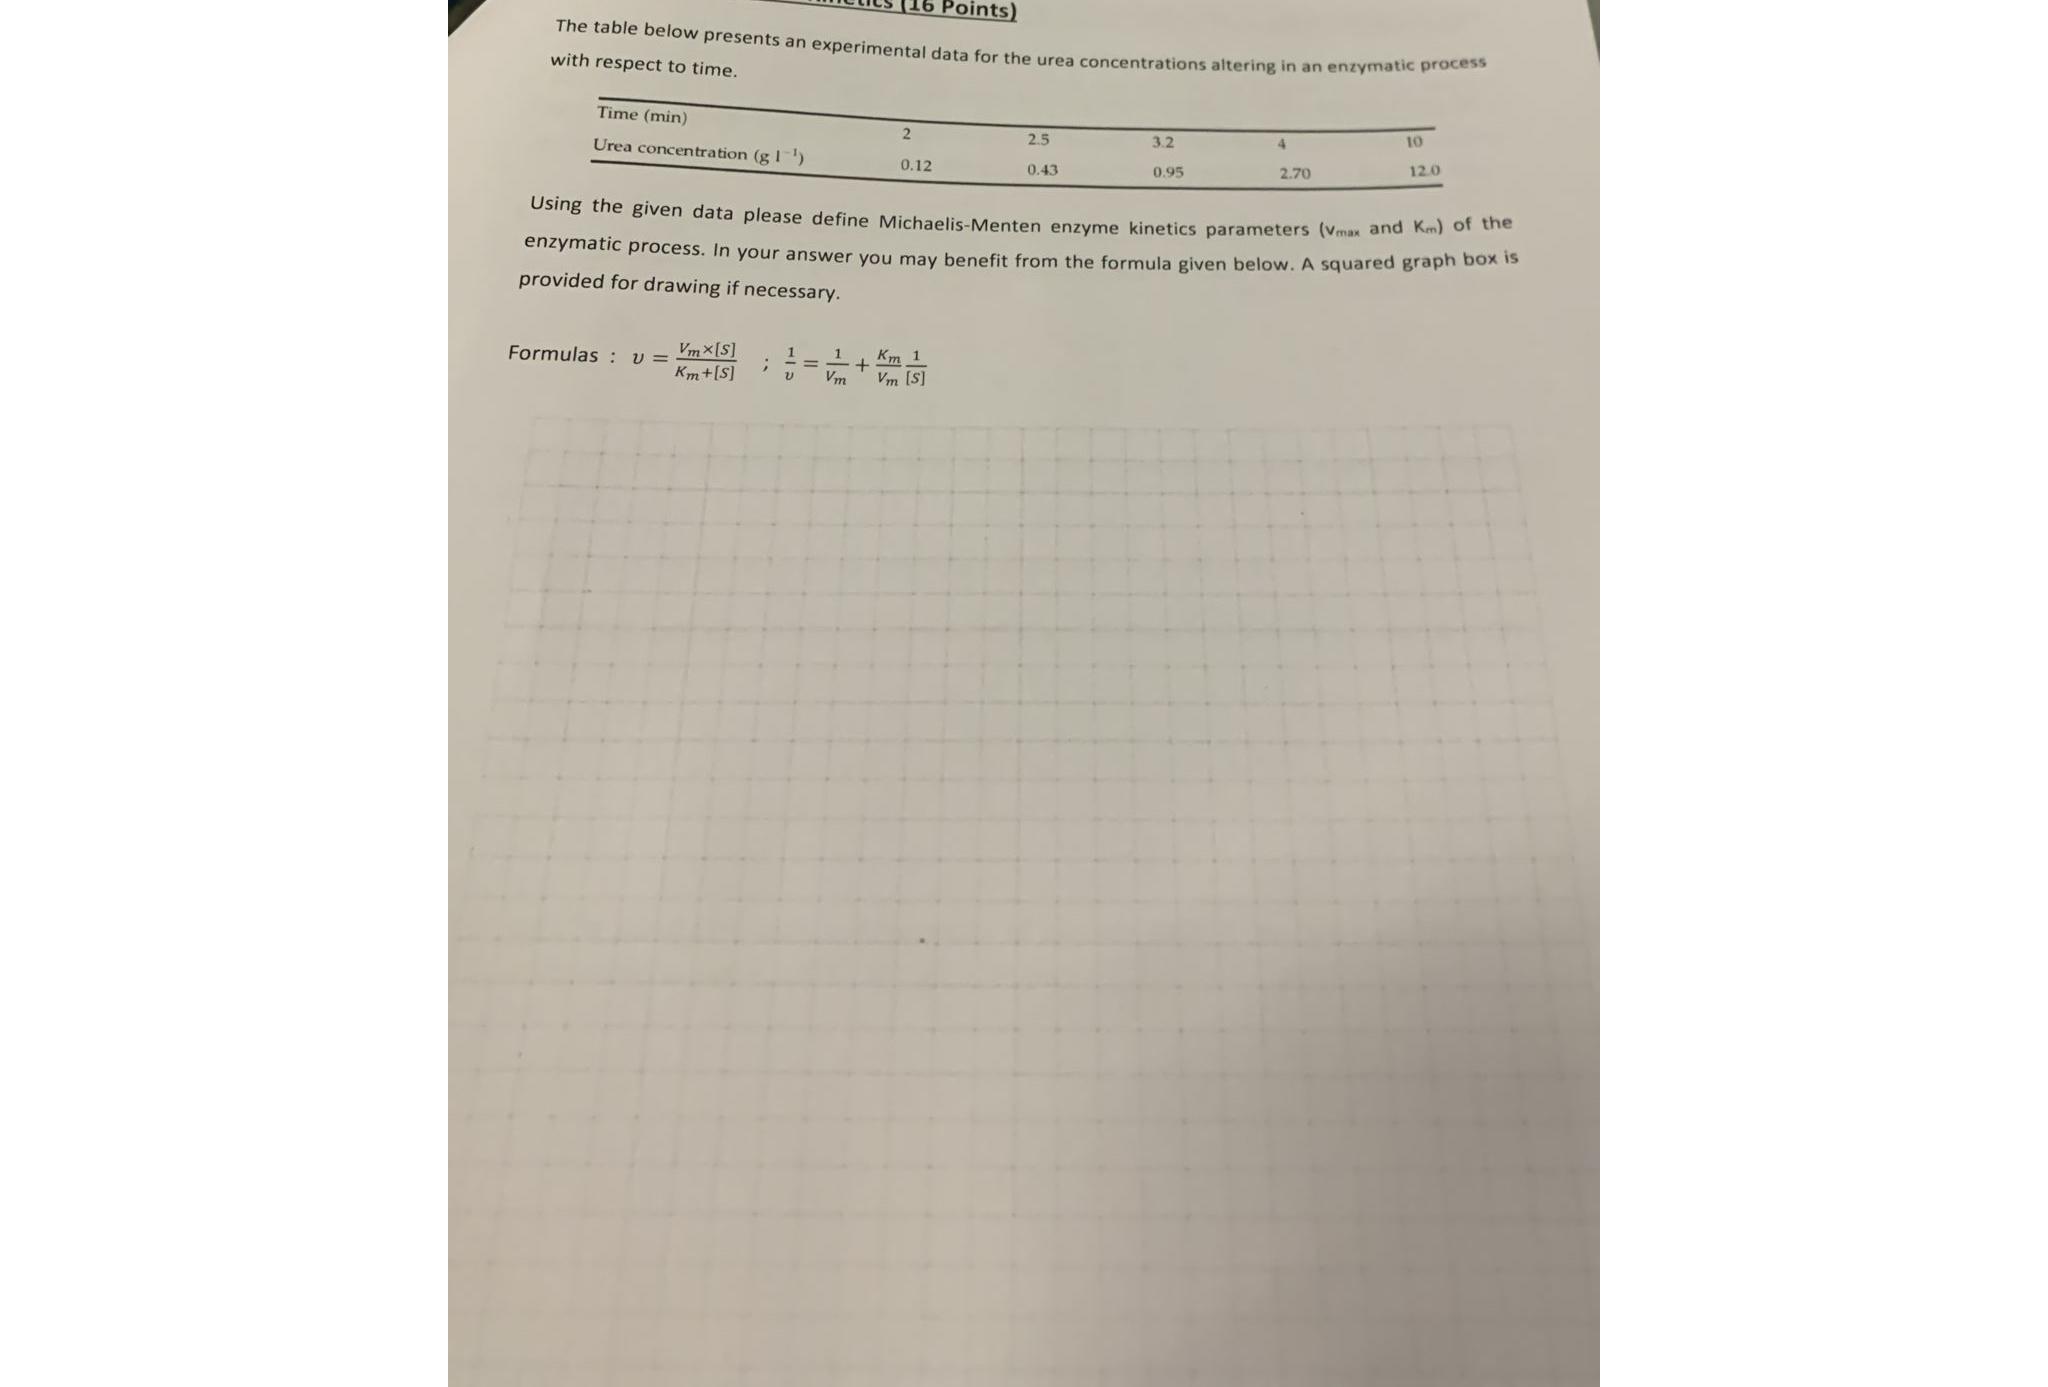
The table below presents an experimental data for the urea concentrations altering in an enzymatic process with respect to time.
tableTime Urea concentration
Using the given data please define MichaelisMenten enzyme kinetics parameters and : of the enzymatic process. In your answer you may benefit from the formula given below. A squared graph box is provided for drawing if necessary.
Formulas : ;
Step by Step Solution
There are 3 Steps involved in it
1 Expert Approved Answer
Step: 1 Unlock

Question Has Been Solved by an Expert!
Get step-by-step solutions from verified subject matter experts
Step: 2 Unlock
Step: 3 Unlock