

Question: The table below presents some data on the federal minimum wage, the CPI-U, and the PCE price index (another price index) for selected years. Year
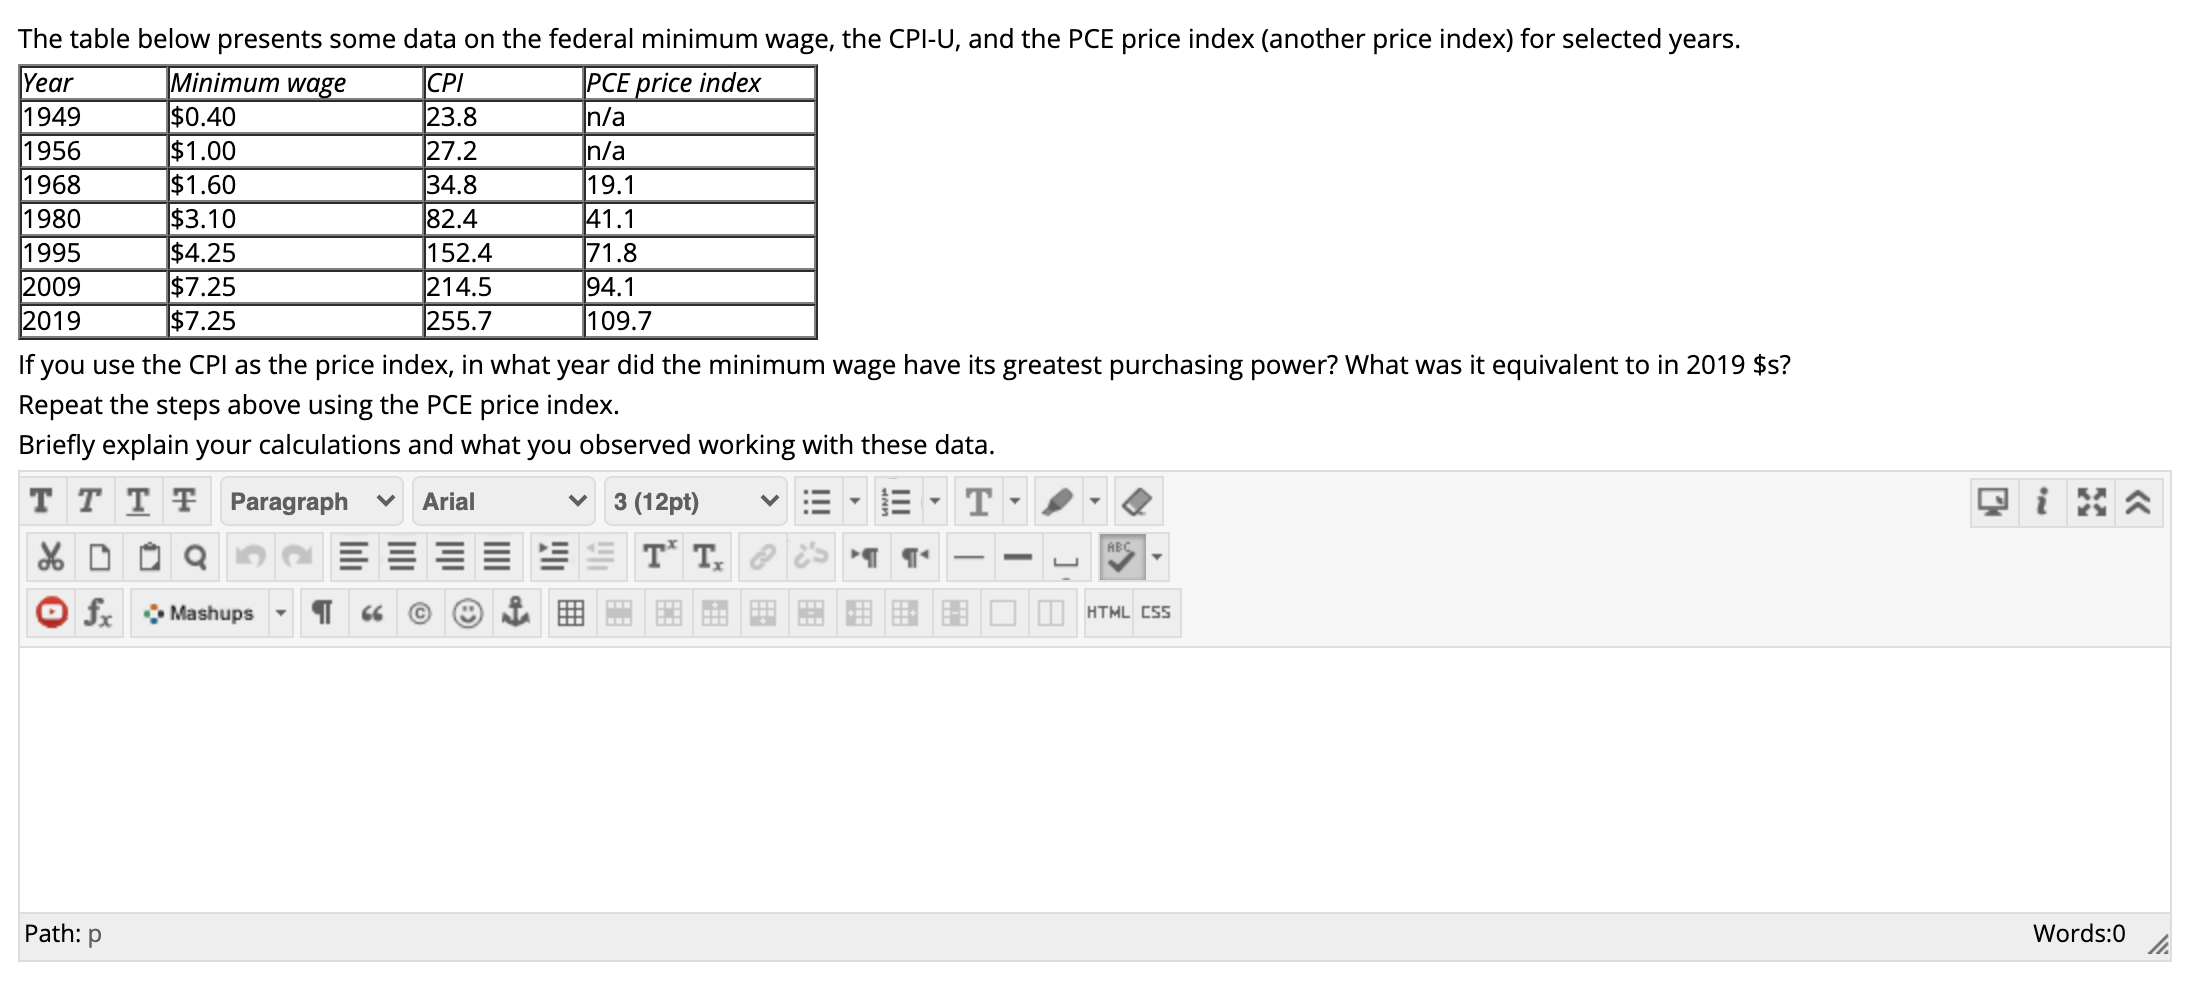
The table below presents some data on the federal minimum wage, the CPI-U, and the PCE price index (another price index) for selected years. Year Minimum wage CPI PCE price index 1949 $0.40 23.8 n/a 1956 $1.00 27.2 n/a 1968 $1.60 34.8 19.1 1980 $3.10 82.4 41.1 1995 $4.25 152.4 71.8 2009 $7.25 214.5 94.1 2019 $7.25 255.7 109.7 If you use the CPI as the price index, in what year did the minimum wage have its greatest purchasing power? What was it equivalent to in 2019 $s? Repeat the steps above using the PCE price index. Briefly explain your calculations and what you observed working with these data. TTTT Paragraph v Arial v 3 (12pt) v E . ET E E T* T, ABC @ fx Mashups * $ 6 @ HTML CSS Path: p Words:0
Step by Step Solution
There are 3 Steps involved in it

Get step-by-step solutions from verified subject matter experts