

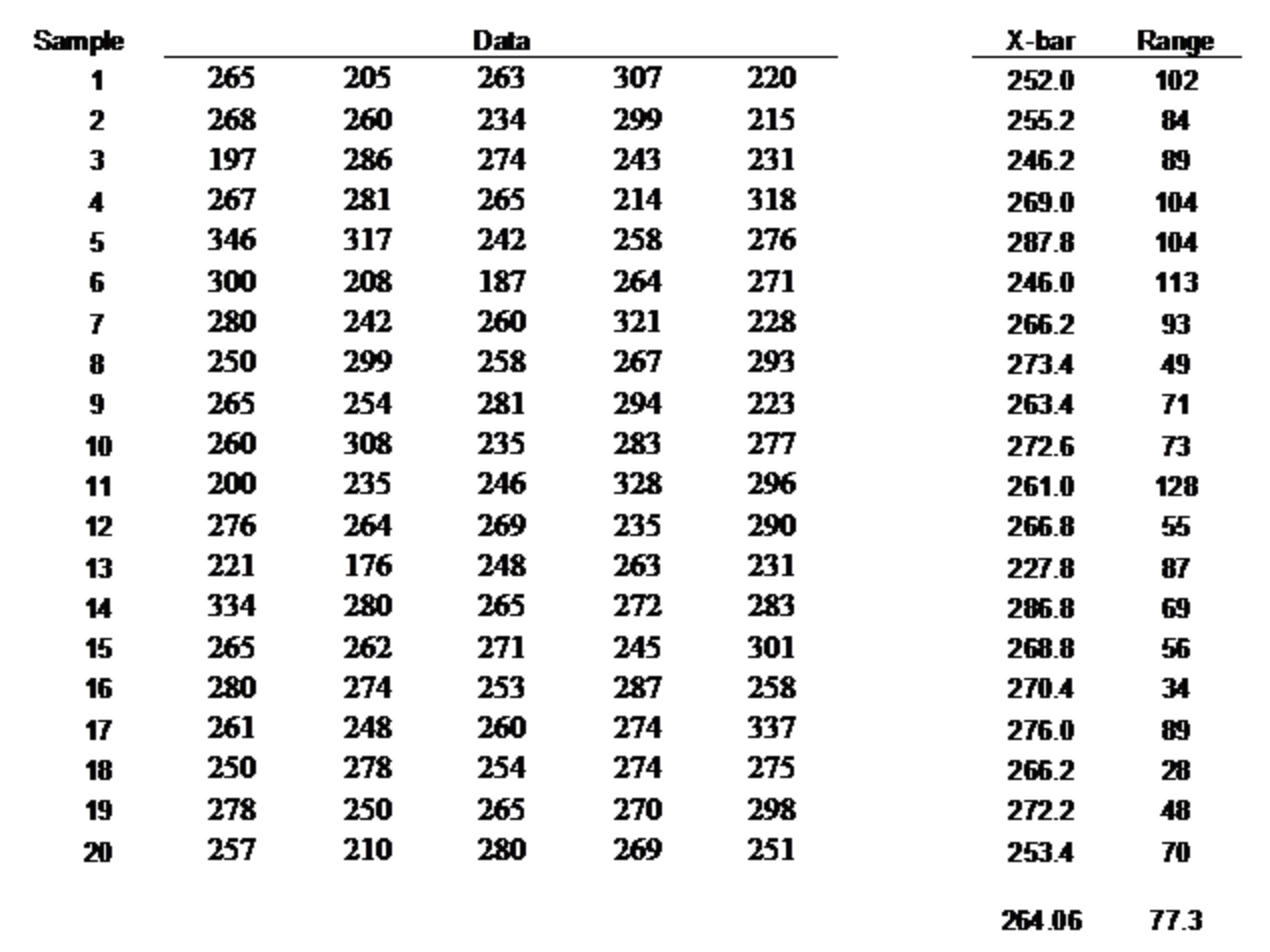
Question: The table below presents the soft drink bottle bursting-strength data in 20 samples of five observations each. From the data, the center line X-bar-bar (X
The table below presents the soft drink bottle bursting-strength data in 20 samples of five observations each. From the data, the center line X-bar-bar (X with two bars on it) is 264.06 and average range R-bar (R with a bar on it) is 77.3.
a.Calculate the parameters (control limits) for the control charts that may be used in monitoring bursting-strength (no need to plot control charts).
b.Do not create or plot the control charts- however, examine the data to tell whether or not the bursting-strength data demonstrate statistical control. Briefly explain your findings.
c. Using the control chart information, calculate the probabilityof producing bottles that will have bursting-strength below 200?
\f
Step by Step Solution
There are 3 Steps involved in it
a Calculate the parameters control limits for the control ... View full answer

Get step-by-step solutions from verified subject matter experts