

Question: The table below provides risk and return data for three shares, plus the correlation coefficients for the return on each pairing of shares. The market
The table below provides risk and return data for three shares, plus the correlation coefficients for the return on each pairing of shares.
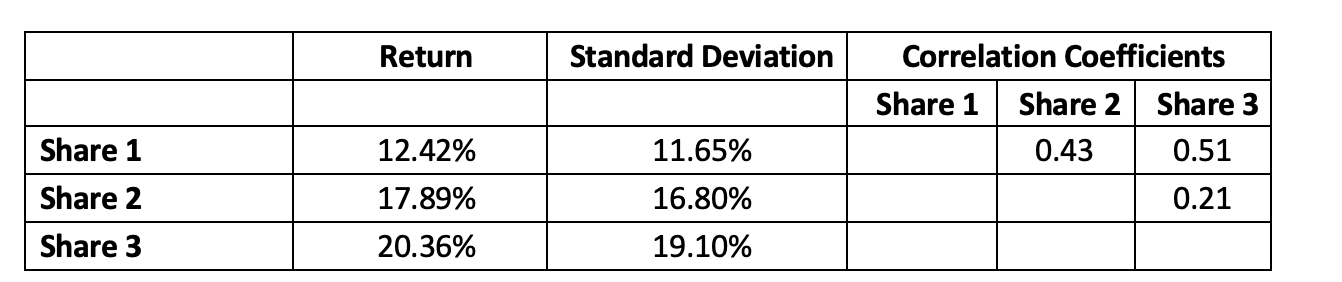
The market portfolio return was 18.76% with a standard deviation of returns of 12.48%. The risk-free return was 0.5%.
Required
a) Calculate the minimum-risk portfolio weightings for each pairing of the three assets in the table.
b) Using the weightings from part a), provide a profile of the risk and return for each two-asset portfolio.
c) Analyse the degree to which the risk-return results for the three pairs of assets support the arguments of portfolio theory.
d) Choose any one of the asset pairings and minimise the risk based on a correlation coefficient of minus 1. Analyse the resulting risk-return relation.
e) Construct an investment in the market portfolio with a risk equal to that of the two-asset portfolio offering the greatest return per unit of risk. Assess the difference between the returns on the two-asset portfolio and the investment in the market portfolio. (Assume that capital can be borrowed or saved at the risk-free rate).
Return Standard Deviation Correlation coefficients Share 1 Share 2 | Share 3 0.43 0.51 0.21 Share 1 12.42% 11.65% Share 2 17.89% 16.80% Share 3 20.36% 19.10%
Step by Step Solution
There are 3 Steps involved in it

Get step-by-step solutions from verified subject matter experts