

Question: The table below provides that realized annual returns for a stock index during six consecutive years. 2014 2015 2016 2017 2018 2019 9.5% 18.4% 10.6%
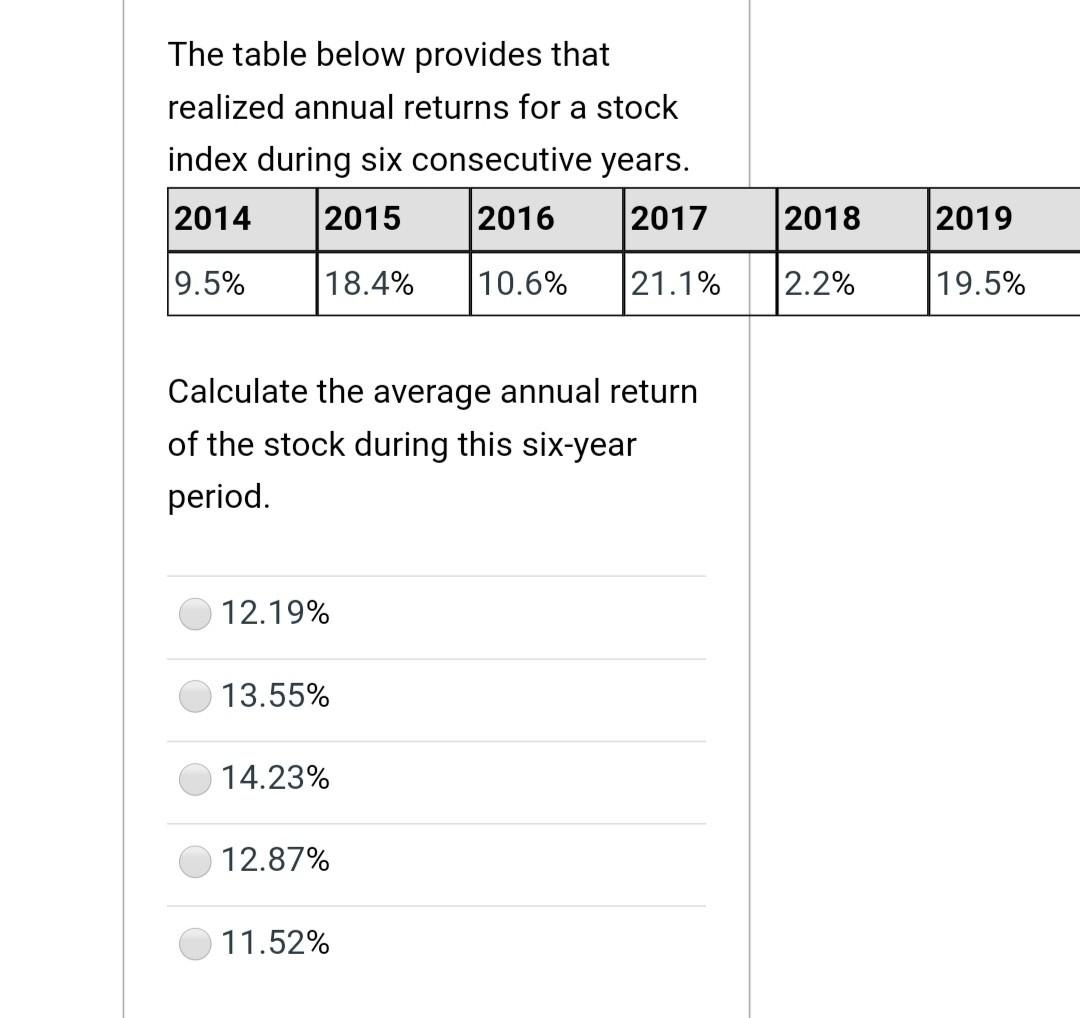
The table below provides that realized annual returns for a stock index during six consecutive years. 2014 2015 2016 2017 2018 2019 9.5% 18.4% 10.6% 21.1% 2.2% 19.5% Calculate the average annual return of the stock during this six-year period. 12.19% 13.55% 14.23% 12.87% 11.52%
Step by Step Solution
There are 3 Steps involved in it
1 Expert Approved Answer
Step: 1 Unlock

Question Has Been Solved by an Expert!
Get step-by-step solutions from verified subject matter experts
Step: 2 Unlock
Step: 3 Unlock