

Question: The table below provides the average annual growth rates (%) in Nominal GDP, Real GDP, Real GDP per capita, prices and population for Australia over
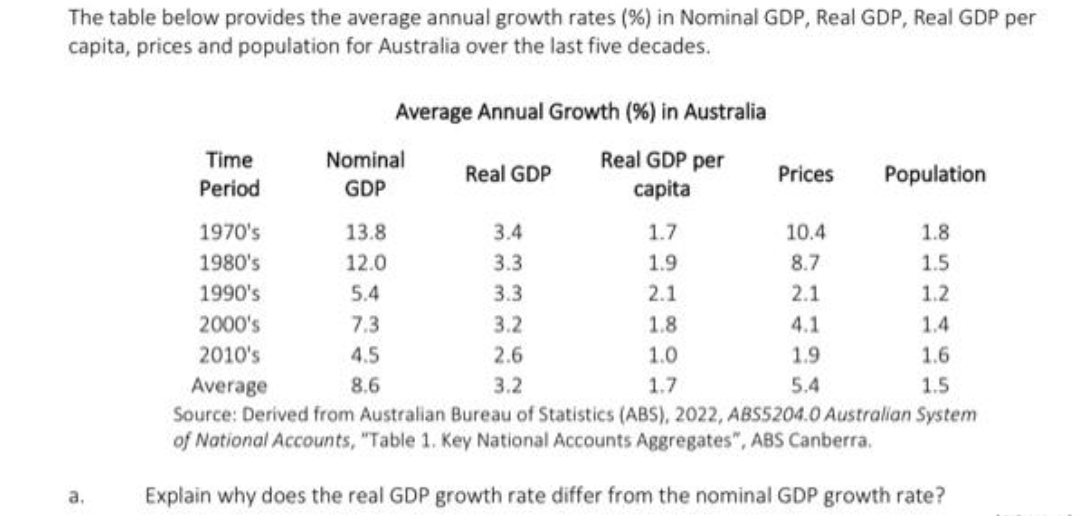
The table below provides the average annual growth rates (%) in Nominal GDP, Real GDP, Real GDP per capita, prices and population for Australia over the last five decades. Average Annual Growth (%) in Australia Time Nominal Real GDP per Real GDP Prices Population Period GDP capita 1970's 13.8 3.4 1.7 10.4 1.8 1980's 12.0 3.3 1.9 8.7 1.5 1990's 5.4 3.3 2.1 2.1 1.2 2000's 7.3 3.2 1.8 4.1 1.4 2010's 4.5 2.6 1.0 1.9 1.6 Average 8.6 3.2 1.7 5.4 1.5 Source: Derived from Australian Bureau of Statistics (ABS), 2022, ABS5204.0 Australian System of National Accounts, "Table 1. Key National Accounts Aggregates", ABS Canberra. a, Explain why does the real GDP growth rate differ from the nominal GDP growth rate
Step by Step Solution
There are 3 Steps involved in it

Get step-by-step solutions from verified subject matter experts