

Question: The table below represents the results from 100 different marketing campaigns performed over three different products; the table splits between the products (Product A, B
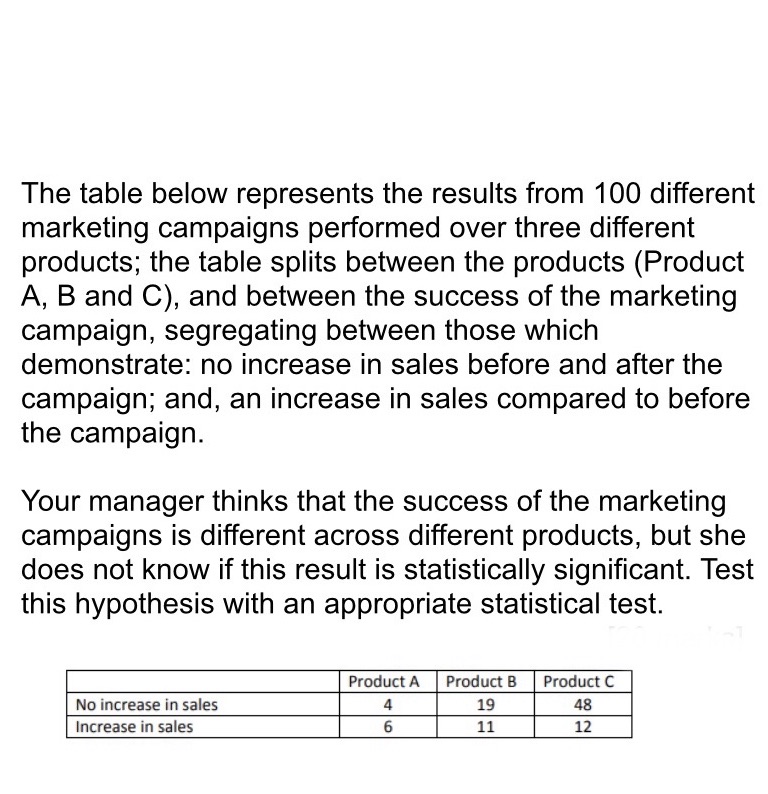

The table below represents the results from 100 different marketing campaigns performed over three different products; the table splits between the products (Product A, B and C), and between the success of the marketing campaign, segregating between those which demonstrate: no increase in sales before and after the campaign; and, an increase in sales compared to before the campaign. Your manager thinks that the success of the marketing campaigns is different across different products, but she does not know if this result is statistically significant. Test this hypothesis with an appropriate statistical test. Product A No increase in sales Increase in sales Product B Product C 11 12
Step by Step Solution
There are 3 Steps involved in it

Get step-by-step solutions from verified subject matter experts