

Question: The table below represents the variation in production cost from months 1 to 5 The R-Squared value of the linear trendline is: R-Squared =0.817 R-Squared
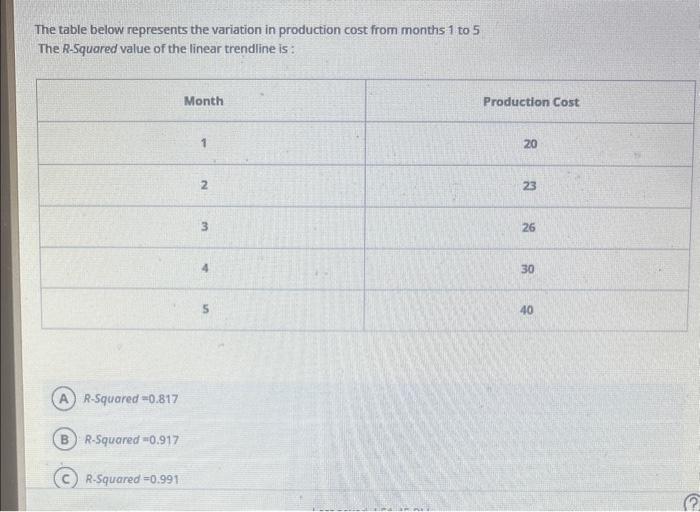
The table below represents the variation in production cost from months 1 to 5 The R-Squared value of the linear trendline is: R-Squared =0.817 R-Squared =0.917 R-Squared =0.991 The table below represents the variation in production cost from months 1 to 5 The R-Squared value of the linear trendline is: R-Squared =0.817 R-Squared =0.917 R-Squared =0.991
Step by Step Solution
There are 3 Steps involved in it
1 Expert Approved Answer
Step: 1 Unlock

Question Has Been Solved by an Expert!
Get step-by-step solutions from verified subject matter experts
Step: 2 Unlock
Step: 3 Unlock