

Question: The table below show data that has been collected from different fields from various farms in a certain valley. The table contains the grams of
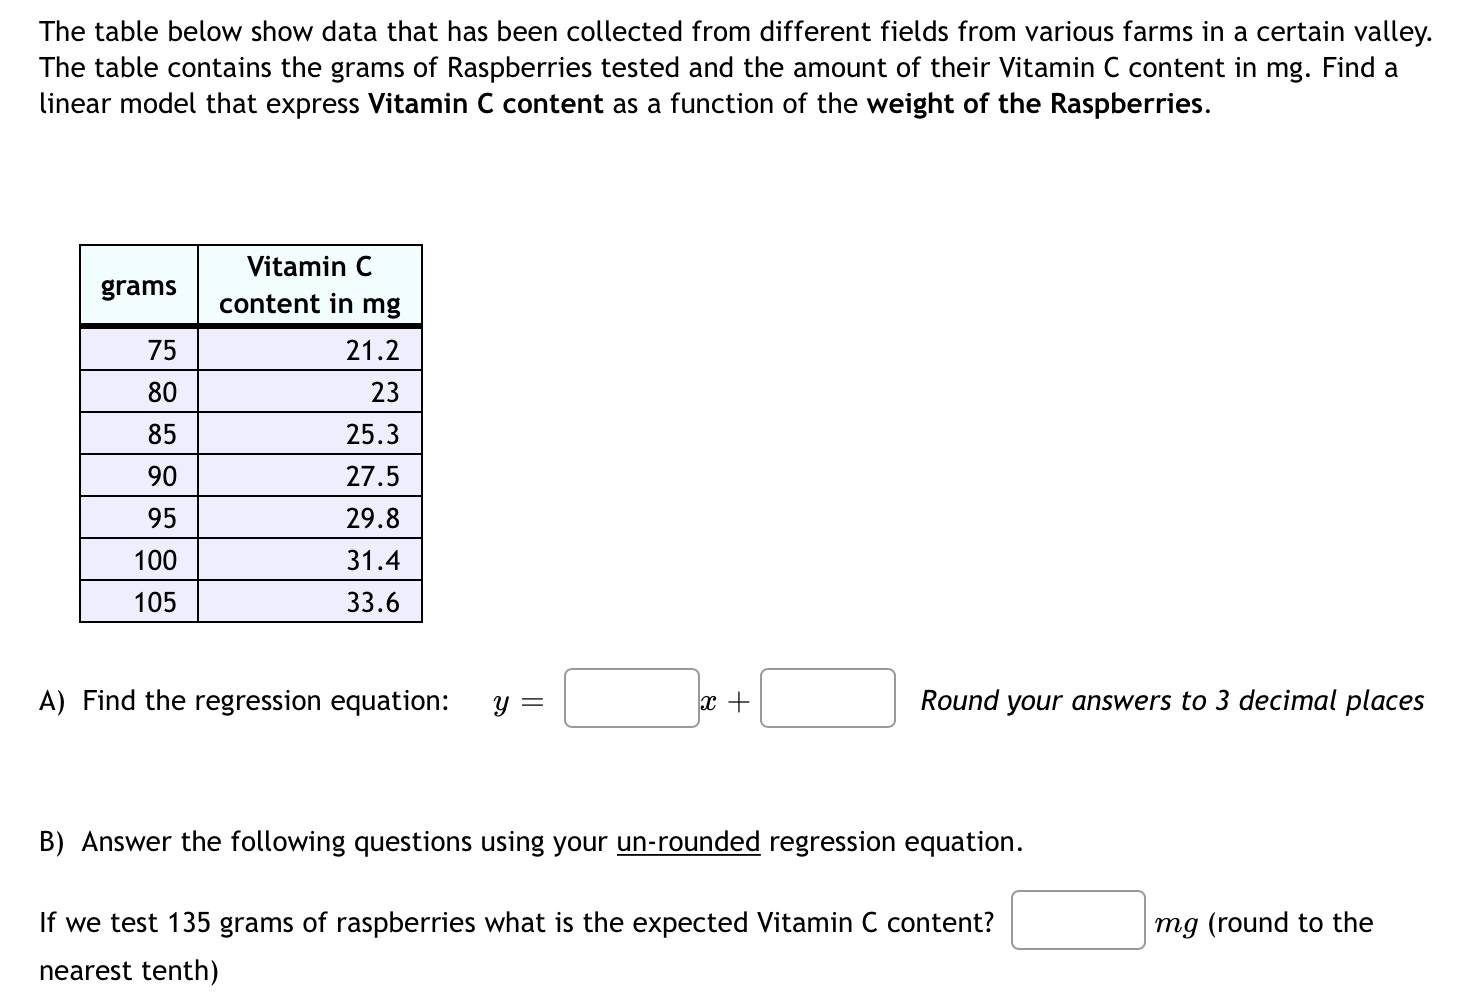

The table below show data that has been collected from different fields from various farms in a certain valley. The table contains the grams of Raspberries tested and the amount of their Vitamin C content in mg. Find a linear model that express Vitamin C content as a function of the weight of the Raspberries. rams Vitamin C g content in mg A) Find the regression equation: y = SI + [3 Round your answers to 3 decimal places B) Answer the following questions using your un-rounded regression equation. If we test 135 grams of raspberries what is the expected Vitamin C content? [:] mg (round to the nearest tenth)
Step by Step Solution
There are 3 Steps involved in it
1 Expert Approved Answer
Step: 1 Unlock

Question Has Been Solved by an Expert!
Get step-by-step solutions from verified subject matter experts
Step: 2 Unlock
Step: 3 Unlock