

Question: The table below show data that has been collected from different fields from various farms in a certain valley. The table contains the grams of
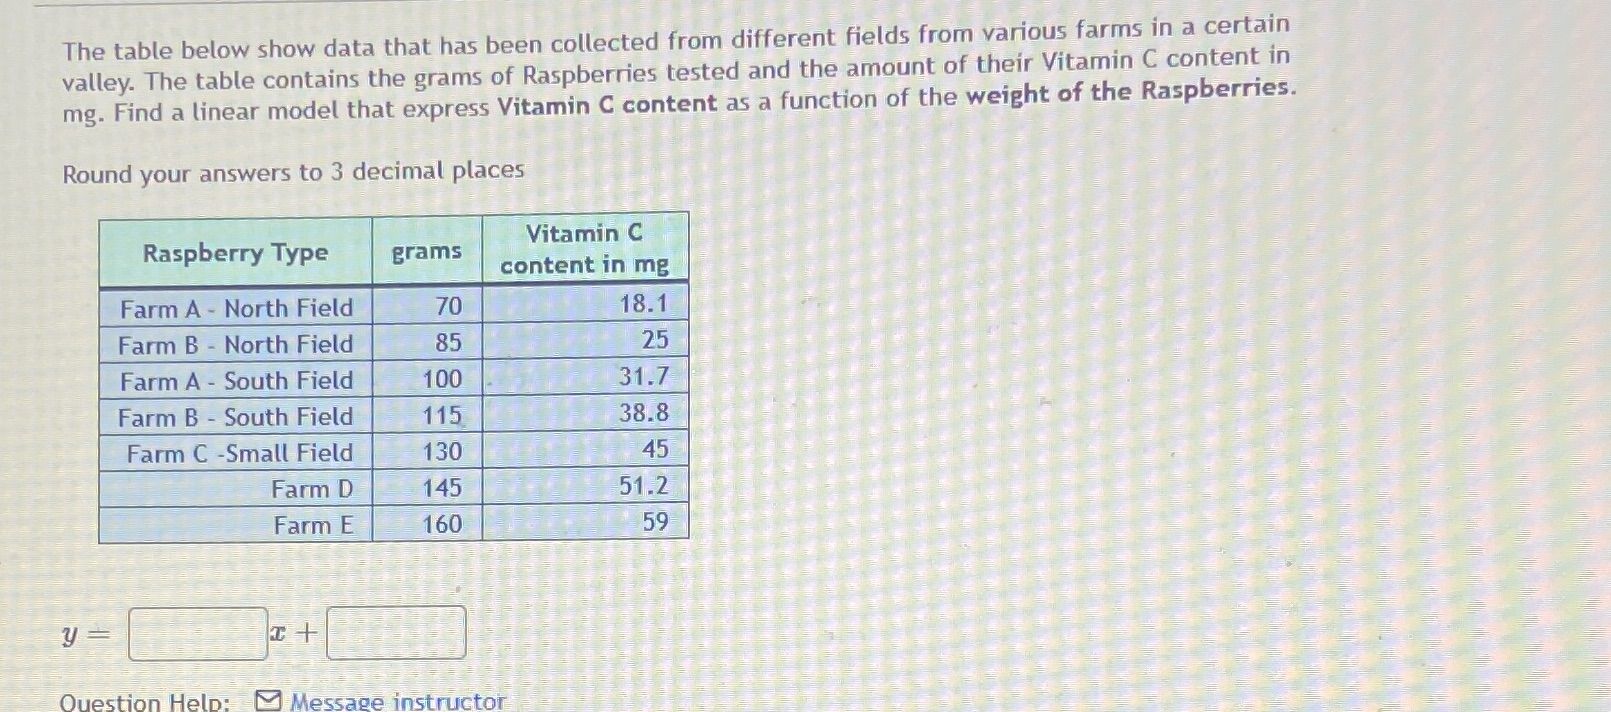
The table below show data that has been collected from different fields from various farms in a certain valley. The table contains the grams of Raspberries tested and the amount of their Vitamin C content in mg. Find a linear model that express Vitamin C content as a function of the weight of the Raspberries. Round your answers to 3 decimal places Raspberry Type Vitamin C grams content in mg Farm A - North Field 70 18.1 Farm B - North Field 85 25 Farm A - South Field 100 31.7 Farm B - South Field 115 38.8 Farm C -Small Field 130 45 Farm D 145 51.2 Farm E 160 59 y Question Help: Message instructor
Step by Step Solution
There are 3 Steps involved in it
1 Expert Approved Answer
Step: 1 Unlock

Question Has Been Solved by an Expert!
Get step-by-step solutions from verified subject matter experts
Step: 2 Unlock
Step: 3 Unlock