

Question: The table below shows actual 2010 data for Canada. Using the data, fill in the blanks. Expenditures Consumption Gross investment Government spending Net exports Gross
The table below shows actual 2010 data for Canada. Using the data, fill in the blanks. Expenditures Consumption Gross investment Government spending Net exports Gross domestic product at market prices Less depreciation Less indirect taxes (net of subsidies) Net domestic product at basic prices +/- net foreign factor income Net national product at basic prices 837 269 356 1,434 90 -28 Incomes Compensation of employees Gross operating surplus Gross mixed income Taxes less subsidies on production Indirect taxes (net of subsidies) Gross domestic income at market prices Less depreciation Less indirect taxes (net of subsidies) Net domestic income at basic prices +/- net foreign factor income (Net) national income Add transfer payments Less undistributed profit Less corporate profit tax Less other income items Personal income Less personal income taxes Disposable income Savings Consumption 749 185 70 256 1,088 56 50 100 1,202 299 66
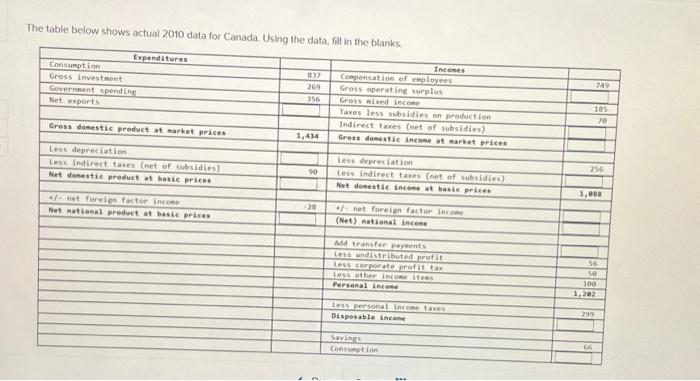
The table below shows actual 2010 data for Canada. Using the data, fill in the blanks
Step by Step Solution
There are 3 Steps involved in it
1 Expert Approved Answer
Step: 1 Unlock

Question Has Been Solved by an Expert!
Get step-by-step solutions from verified subject matter experts
Step: 2 Unlock
Step: 3 Unlock