

Question: The table below shows an aggregate demand and aggregate supply schedule for Aptonville in 2013. Price level Aggregate Demand Short-Run Aggregate Supply 100 $1455.00
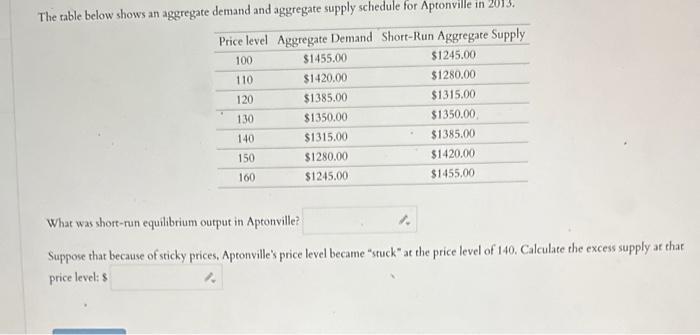
The table below shows an aggregate demand and aggregate supply schedule for Aptonville in 2013. Price level Aggregate Demand Short-Run Aggregate Supply 100 $1455.00 $1245.00 110 $1420.00 $1280.00 120 $1385.00 $1315.00 130 $1350.00 $1350.00 140 $1315.00 $1385.00 150 $1280.00 $1420.00 160 $1245.00 $1455.00 What was short-run equilibrium output in Aptonville? Suppose that because of sticky prices. Aptonville's price level became "stuck" at the price level of 140. Calculate the excess supply at that price level: $ 7.
Step by Step Solution
There are 3 Steps involved in it
1 Expert Approved Answer
Step: 1 Unlock

Question Has Been Solved by an Expert!
Get step-by-step solutions from verified subject matter experts
Step: 2 Unlock
Step: 3 Unlock