

Question: The table below shows Consumer Y's monthly purchases during 2019, 2020 and 2021. _ Quantities Consumed per Month {2019) {2020) {2021) {2019) {2020) {2021) M
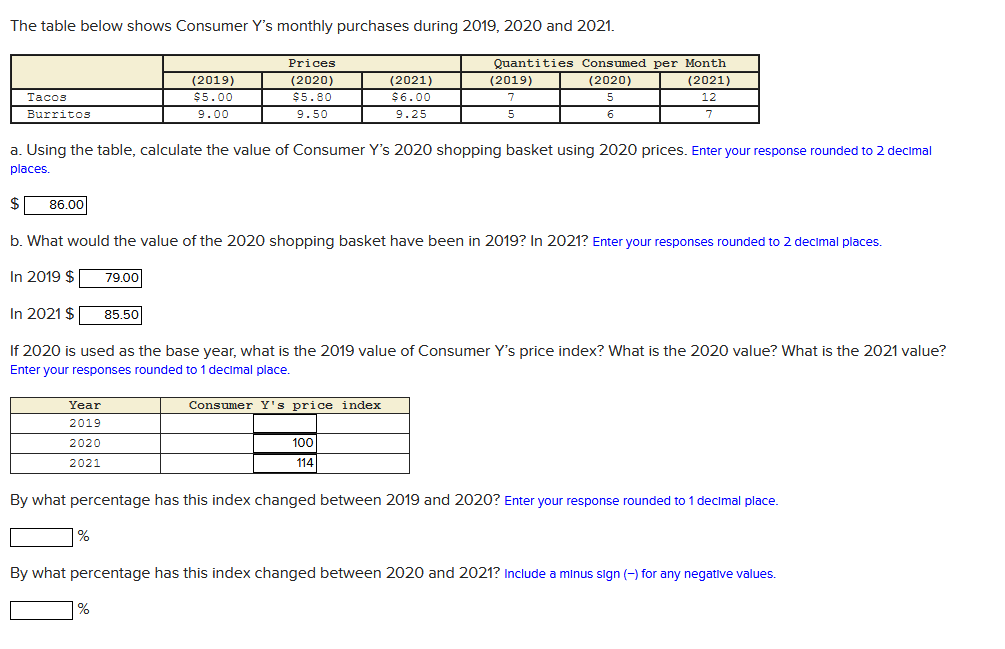
The table below shows Consumer Y's monthly purchases during 2019, 2020 and 2021. _ Quantities Consumed per Month {2019) {2020) {2021) {2019) {2020) {2021) M a. Using the table, calculate the value of Consumer Y's 2020 shopping basket using 2020 prices. Enter your response rounded to 2 decimal places. 5- so .00 b. What would the value of the 2020 Shopping basket have been in 2019? In 2021? Enter your responses rounded to 2 decimal places. In 2019 $ 19.00 In 2021 $ 85.50 If 2020 is used as the base year, what is the 2019 value of Consumer Y's price index? What is the 2020 value? What is the 2021 value? Enter your responses rounded to 1 decimal place. Year 2019 2020 2021 By what percentage has this index changed between 2019 and 2020? Enter your response rounded to 1 decimal place. '31: By what percentage has this index changed between 2020 and 2021? Include a minus sign (1 for any negative values. '31
Step by Step Solution
There are 3 Steps involved in it

Get step-by-step solutions from verified subject matter experts