

Question: The table below shows historical data on U . S . exports and imports of goods and services for five years. For each of these
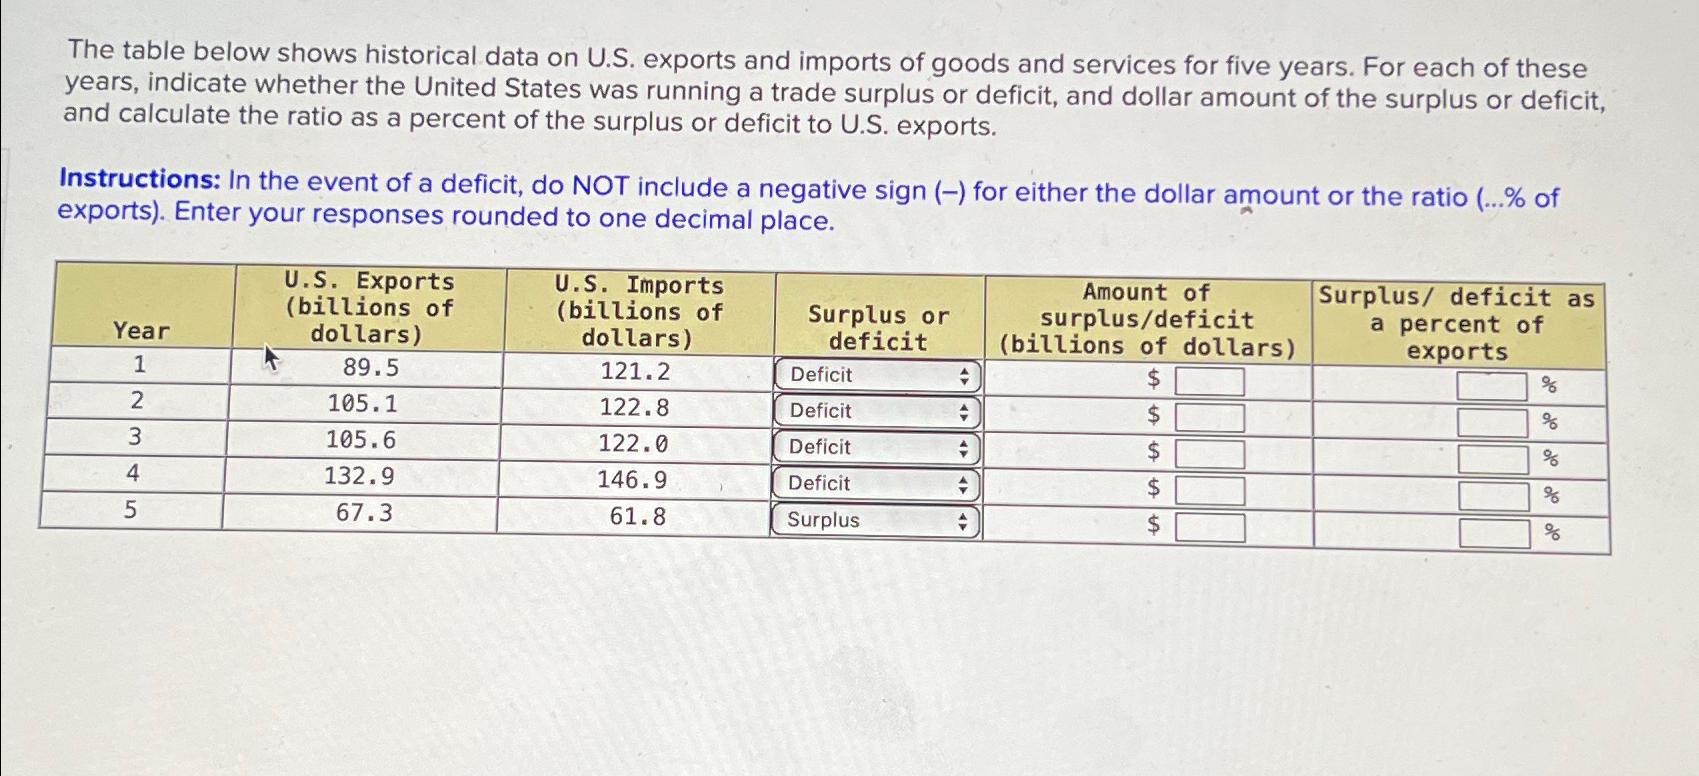
The table below shows historical data on US exports and imports of goods and services for five years. For each of these years, indicate whether the United States was running a trade surplus or deficit, and dollar amount of the surplus or deficit, and calculate the ratio as a percent of the surplus or deficit to US exports.
Instructions: In the event of a deficit, do NOT include a negative sign for either the dollar amount or the ratio of exports Enter your responses rounded to one decimal place.
Step by Step Solution
There are 3 Steps involved in it
1 Expert Approved Answer
Step: 1 Unlock

Question Has Been Solved by an Expert!
Get step-by-step solutions from verified subject matter experts
Step: 2 Unlock
Step: 3 Unlock