

Question: The table below shows historical end-of-week adjusted close prices (including dividends) for a stock and the S&P 500. A B C 1 Week Stock S&P
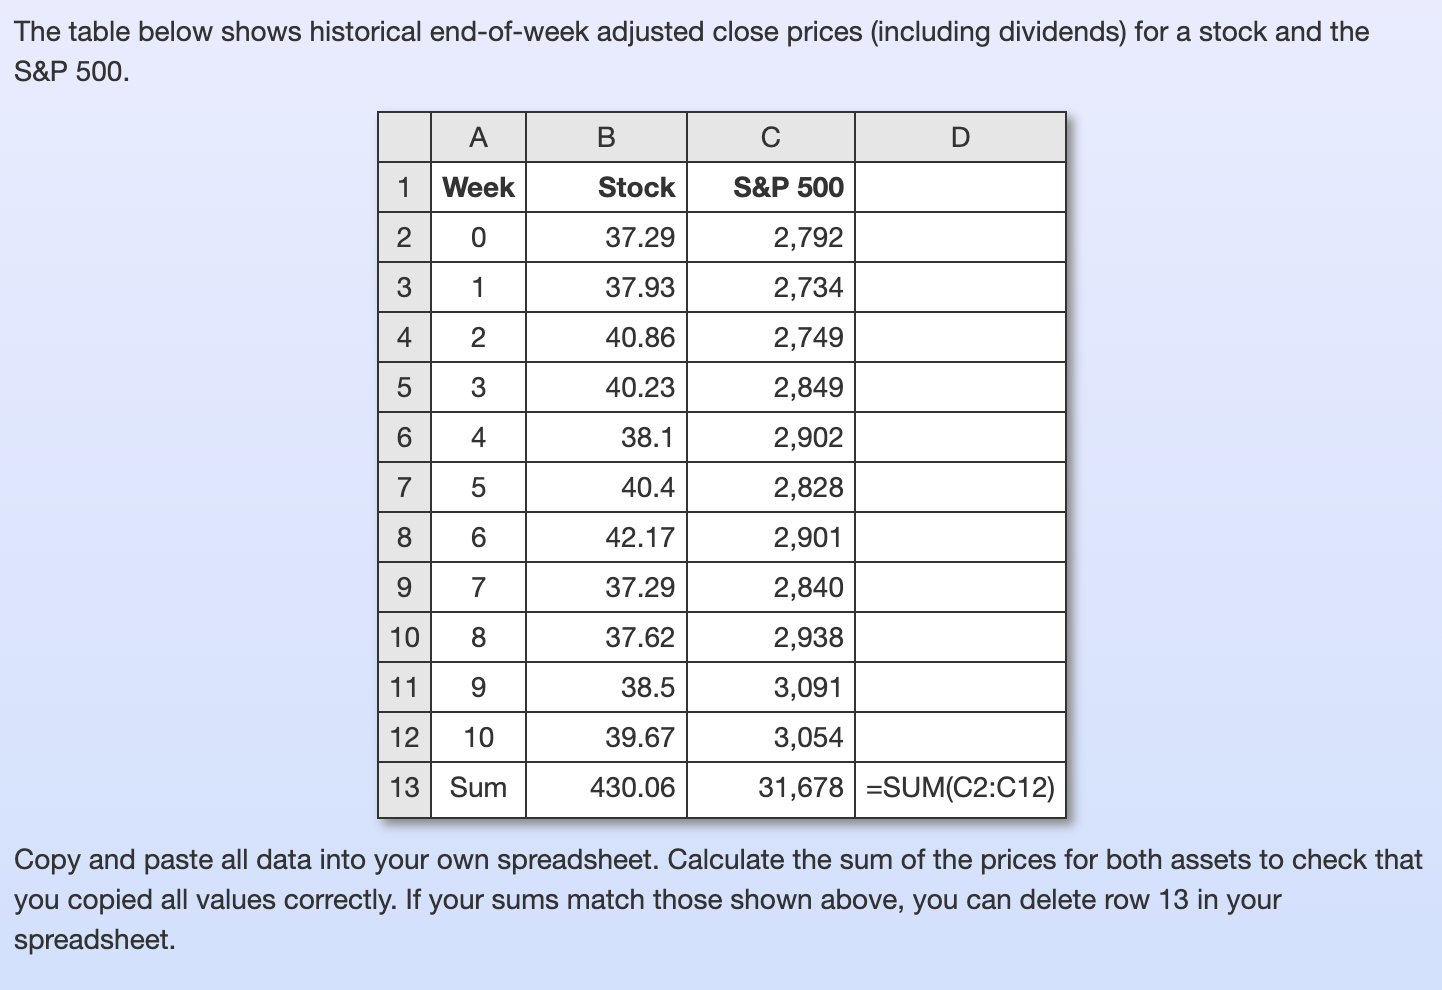
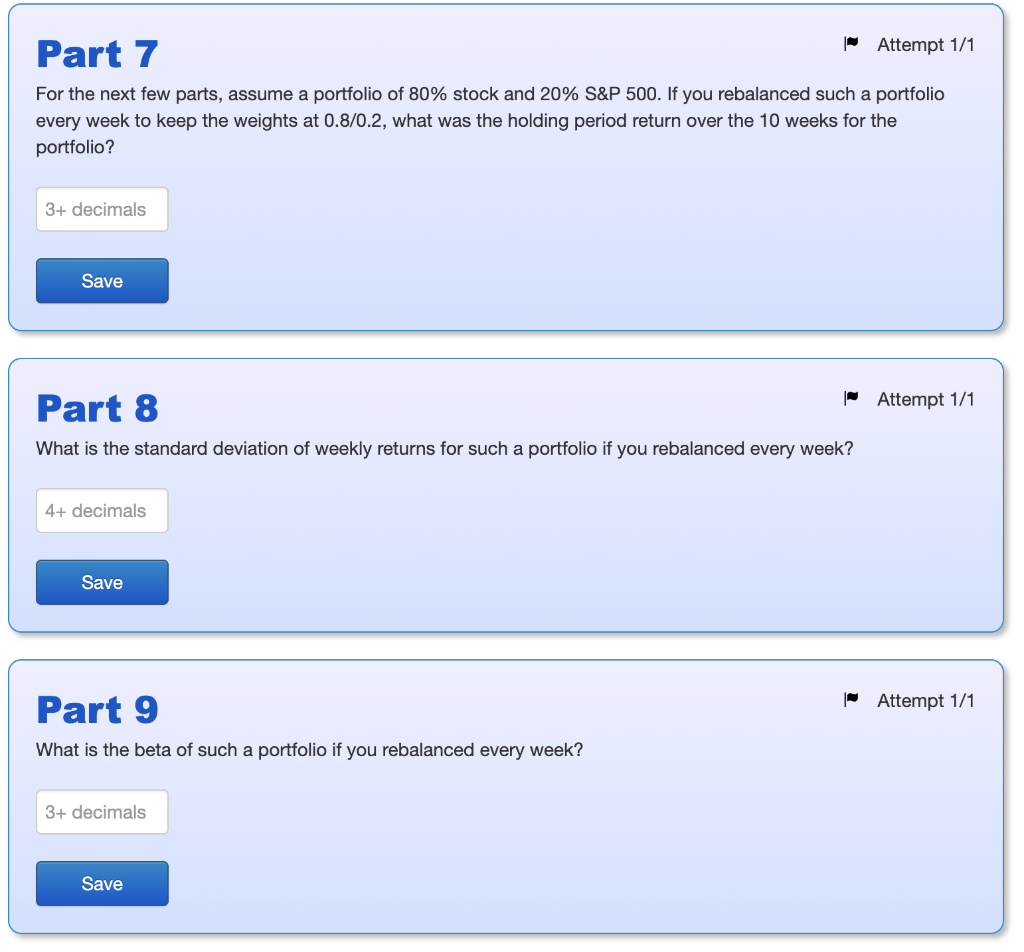
The table below shows historical end-of-week adjusted close prices (including dividends) for a stock and the S&P 500. A B C 1 Week Stock S&P 500 2 37.29 2,792 3 37.93 2,734 4 40.86 2,749 5 40.23 2,849 6 38.1 2,902 7 40.4 2,828 8 42.17 2,901 9 37.29 2,840 10 37.62 2,938 11 9 38.5 3,091 12 10 39.67 3,054 13 Sum 430.06 31,678=SUM(C2:C12) Copy and paste all data into your own spreadsheet. Calculate the sum of the prices for both assets to check that you copied all values correctly. If your sums match those shown above, you can delete row 13 in your spreadsheet. O 1 2 3 4 5 6 7 Part 7 Attempt 1/1 For the next few parts, assume a portfolio of 80% stock and 20% S&P 500. If you rebalanced such a portfolio every week to keep the weights at 0.8/0.2, what was the holding period return over the 10 weeks for the portfolio? 3+ decimals Save Attempt 1/1 Part 8 What is the standard deviation of weekly returns for such a portfolio if you rebalanced every week? 4+ decimals Save Part 9 Attempt 1/1 What is the beta of such a portfolio if you rebalanced every week? 3+ decimals Save The table below shows historical end-of-week adjusted close prices (including dividends) for a stock and the S&P 500. A B C 1 Week Stock S&P 500 2 37.29 2,792 3 37.93 2,734 4 40.86 2,749 5 40.23 2,849 6 38.1 2,902 7 40.4 2,828 8 42.17 2,901 9 37.29 2,840 10 37.62 2,938 11 9 38.5 3,091 12 10 39.67 3,054 13 Sum 430.06 31,678=SUM(C2:C12) Copy and paste all data into your own spreadsheet. Calculate the sum of the prices for both assets to check that you copied all values correctly. If your sums match those shown above, you can delete row 13 in your spreadsheet. O 1 2 3 4 5 6 7 Part 7 Attempt 1/1 For the next few parts, assume a portfolio of 80% stock and 20% S&P 500. If you rebalanced such a portfolio every week to keep the weights at 0.8/0.2, what was the holding period return over the 10 weeks for the portfolio? 3+ decimals Save Attempt 1/1 Part 8 What is the standard deviation of weekly returns for such a portfolio if you rebalanced every week? 4+ decimals Save Part 9 Attempt 1/1 What is the beta of such a portfolio if you rebalanced every week? 3+ decimals Save
Step by Step Solution
There are 3 Steps involved in it

Get step-by-step solutions from verified subject matter experts