

Question: The table below shows historical end-of-week adjusted close prices (including dividends) for a stock and the S&P 500. What is the annual Sharpe ratio of
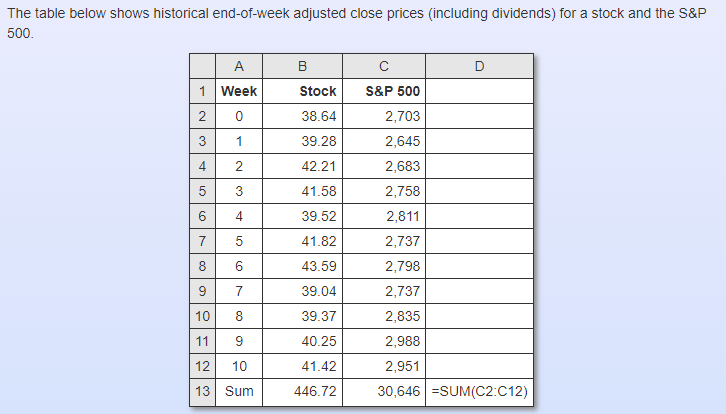
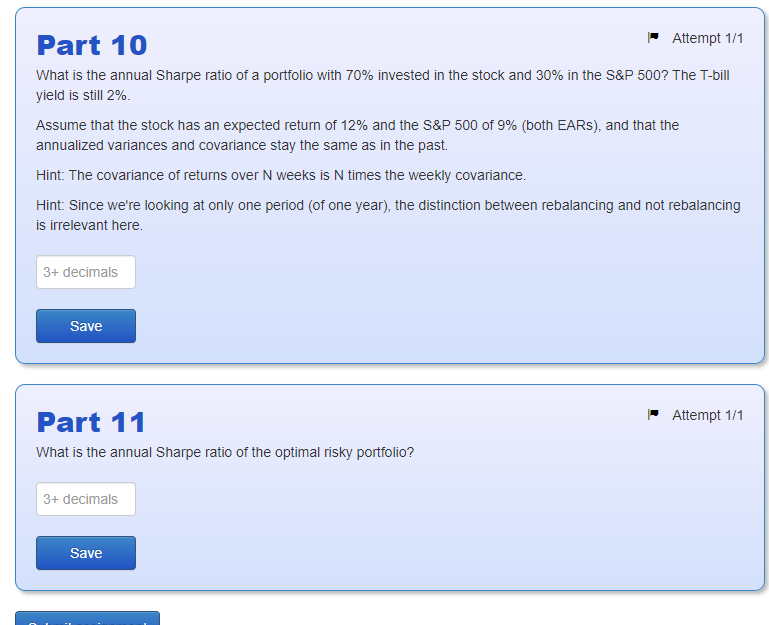
The table below shows historical end-of-week adjusted close prices (including dividends) for a stock and the S\&P 500. What is the annual Sharpe ratio of a portfolio with 70% invested in the stock and 30% in the S\&P 500 ? The T-bill yield is still 2%. Assume that the stock has an expected return of 12% and the S\&P 500 of 9% (both EARs), and that the annualized variances and covariance stay the same as in the past. Hint: The covariance of returns over N weeks is N times the weekly covariance. Hint: Since we're looking at only one period (of one year), the distinction between rebalancing and not rebalancing is irrelevant here. Part 11 Attempt 1/1 What is the annual Sharpe ratio of the optimal risky portfolio? The table below shows historical end-of-week adjusted close prices (including dividends) for a stock and the S\&P 500. What is the annual Sharpe ratio of a portfolio with 70% invested in the stock and 30% in the S\&P 500 ? The T-bill yield is still 2%. Assume that the stock has an expected return of 12% and the S\&P 500 of 9% (both EARs), and that the annualized variances and covariance stay the same as in the past. Hint: The covariance of returns over N weeks is N times the weekly covariance. Hint: Since we're looking at only one period (of one year), the distinction between rebalancing and not rebalancing is irrelevant here. Part 11 Attempt 1/1 What is the annual Sharpe ratio of the optimal risky portfolio
Step by Step Solution
There are 3 Steps involved in it

Get step-by-step solutions from verified subject matter experts