

Question: The table below shows nominal and real GDP for the United States between 2016 and 2019. Real GDP was computed using 2009 as the
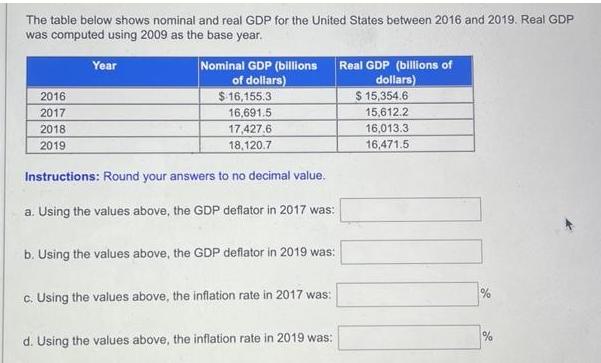
The table below shows nominal and real GDP for the United States between 2016 and 2019. Real GDP was computed using 2009 as the base year. 2016 2017 2018 2019 Year Nominal GDP (billions of dollars) $ 16,155.3 16,691.5 17,427.6 18,120.7 Instructions: Round your answers to no decimal value. a. Using the values above, the GDP deflator in 2017 was: b. Using the values above, the GDP deflator in 2019 was: c. Using the values above, the inflation rate in 2017 was: d. Using the values above, the inflation rate in 2019 was: Real GDP (billions of dollars) $ 15,354.6 15,612.2 16,013.3 16,471.5 % %
Step by Step Solution
3.36 Rating (152 Votes )
There are 3 Steps involved in it
a The GDP deflator in 2017 can be calculated as GDP deflator in 2017 Nominal GDP in 2017 Real GDP in ... View full answer

Get step-by-step solutions from verified subject matter experts