

Question: The table below shows soil sieve analysis data. A hydrometer analysis performed in accordance with AASHTO T 8 8 was used on the portion of
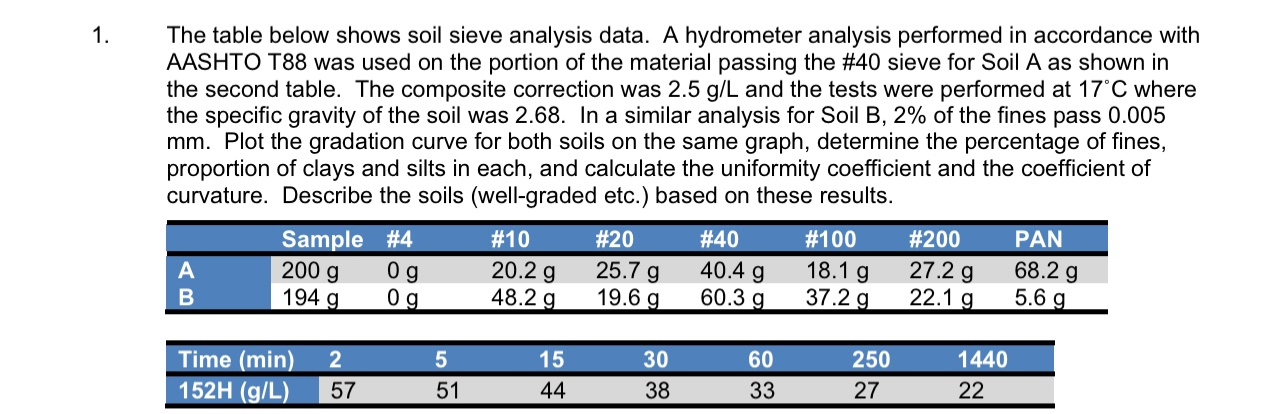
The table below shows soil sieve analysis data. A hydrometer analysis performed in accordance with AASHTO T was used on the portion of the material passing the # sieve for Soil A as shown in the second table. The composite correction was and the tests were performed at where the specific gravity of the soil was In a similar analysis for Soil B of the fines pass Plot the gradation curve for both soils on the same graph, determine the percentage of fines, proportion of clays and silts in each, and calculate the uniformity coefficient and the coefficient of curvature. Describe the soils wellgraded etc. based on these results.
tableSample,######PANA
Step by Step Solution
There are 3 Steps involved in it
1 Expert Approved Answer
Step: 1 Unlock

Question Has Been Solved by an Expert!
Get step-by-step solutions from verified subject matter experts
Step: 2 Unlock
Step: 3 Unlock