

Question: The table below shows the 10-year SD, the average annual return, and the Sharpe Ratiofor the VDAIX, the S&P 500. Ignore the LB category, which
The table below shows the 10-year SD, the average annual return, and the Sharpe Ratiofor the VDAIX, the S&P 500. Ignore the LB category, which tracks so-called large blend stock funds.
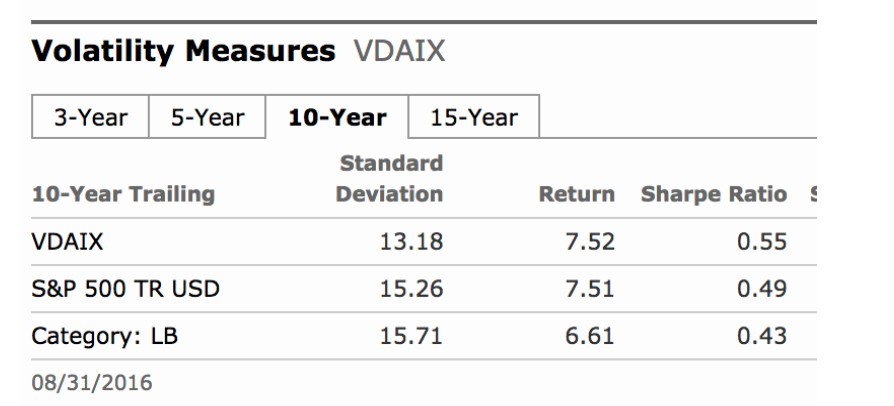
A) VDAIX and the S&P500 had almost identical returns over the last ten years, but VDAIX had a substantially higher Sharpe Ratio. Why? Explain making use of the definition of the Sharpe Ratio.
B) The risk-free rate is not shown. Can you back it out using the data for VDAIX? Show your work.
C) Which measure (average annual return or geometric mean) do you regard as the better measure of how this fund did? Why?
D) If an investor had to choose between the S&P 500 index fund that tracks the index nearly perfectly and the VDAIX fund, which would you recommend? Why?
Volatility Measures VDAIX
Step by Step Solution
There are 3 Steps involved in it

Get step-by-step solutions from verified subject matter experts