

Question: The table below shows the actual demand over a six - month period for a travel service that offers a tour of a recently discovered
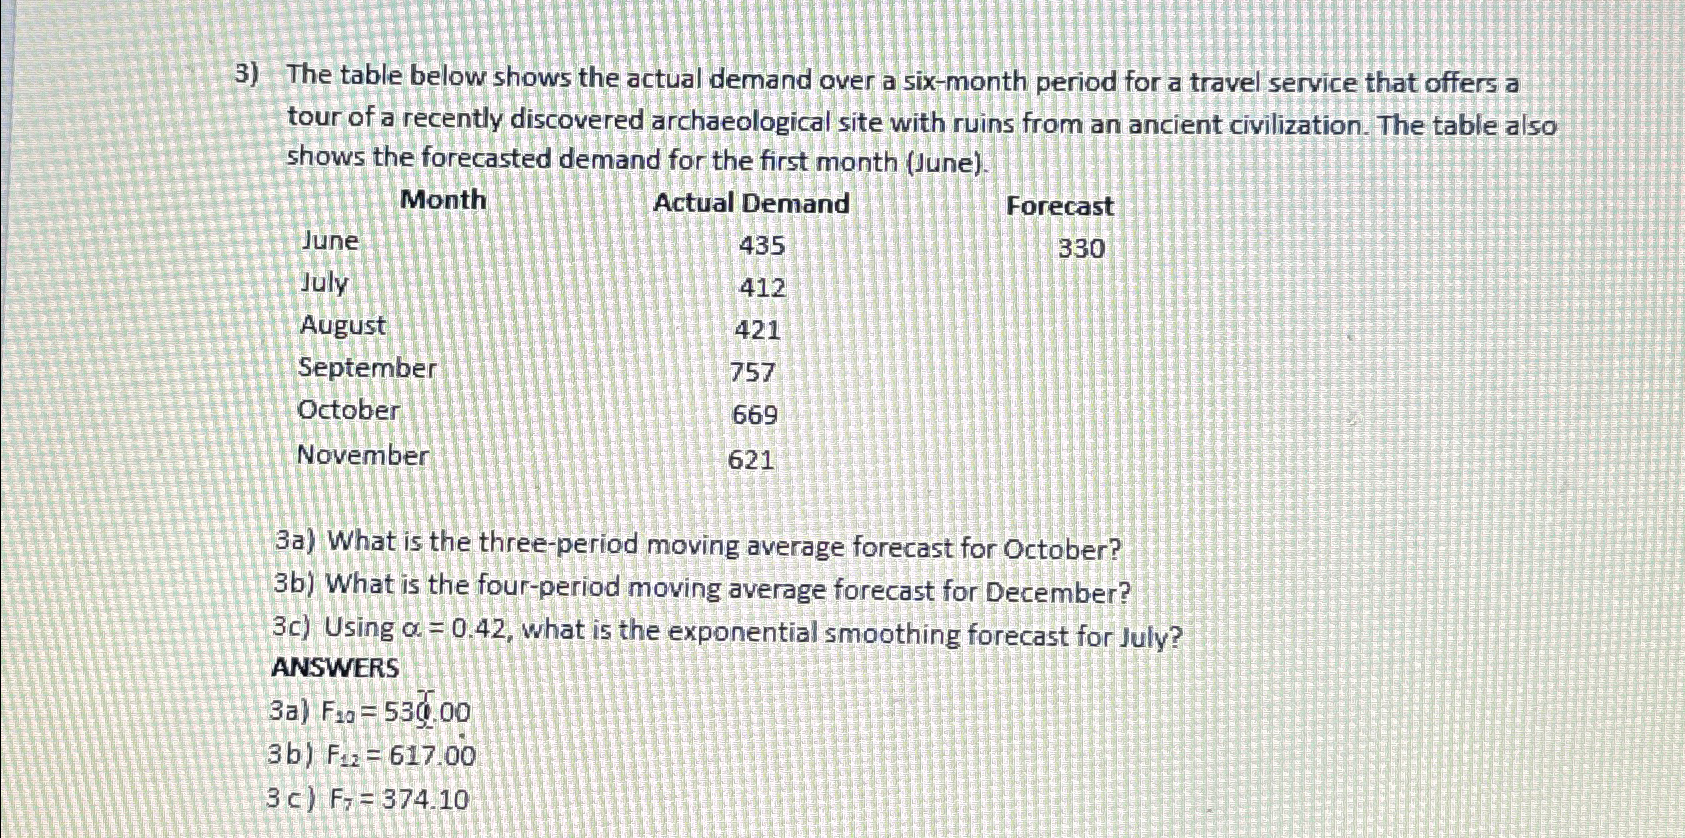
The table below shows the actual demand over a sixmonth period for a travel service that offers a tour of a recently discovered archaeological site with ruins from an ancient civilization. The table also shows the forecasted demand for the first month June
tableMonthActual Demand,ForecastJuneJulyAugustSeptemberOctoberNovember
a What is the threeperiod moving average forecast for October?
b What is the fourperiod moving average forecast for December?
c Using what is the exponential smoothing forecast for July?
ANSWERS
a
b
c
Step by Step Solution
There are 3 Steps involved in it
1 Expert Approved Answer
Step: 1 Unlock

Question Has Been Solved by an Expert!
Get step-by-step solutions from verified subject matter experts
Step: 2 Unlock
Step: 3 Unlock