

Question: The table below shows the annual changes in CPI from Year 1 to Year 4. During which year did this economy experience deflation? Percentage
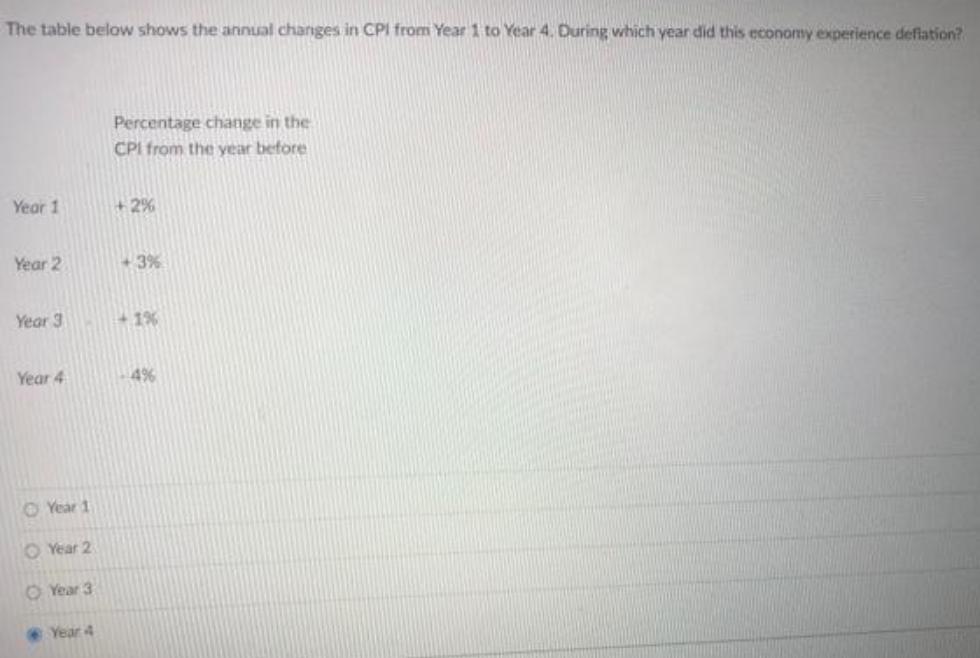
The table below shows the annual changes in CPI from Year 1 to Year 4. During which year did this economy experience deflation? Percentage change in the CPI from the year before Year 1 +2% Year 2 +3% Year 3 1% Year 4 4% O Year 1 O Year 2 O Year 3 Year 4
Step by Step Solution
★★★★★
3.42 Rating (146 Votes )
There are 3 Steps involved in it
1 Expert Approved Answer
Step: 1 Unlock

The correct answer is D Year 4 Inflation is an increase in th... View full answer
Question Has Been Solved by an Expert!
Get step-by-step solutions from verified subject matter experts
Step: 2 Unlock
Step: 3 Unlock