

Question: The table below shows the annual returns for two stocks during each year in a 5 year period. Use this information to approximate the correlation
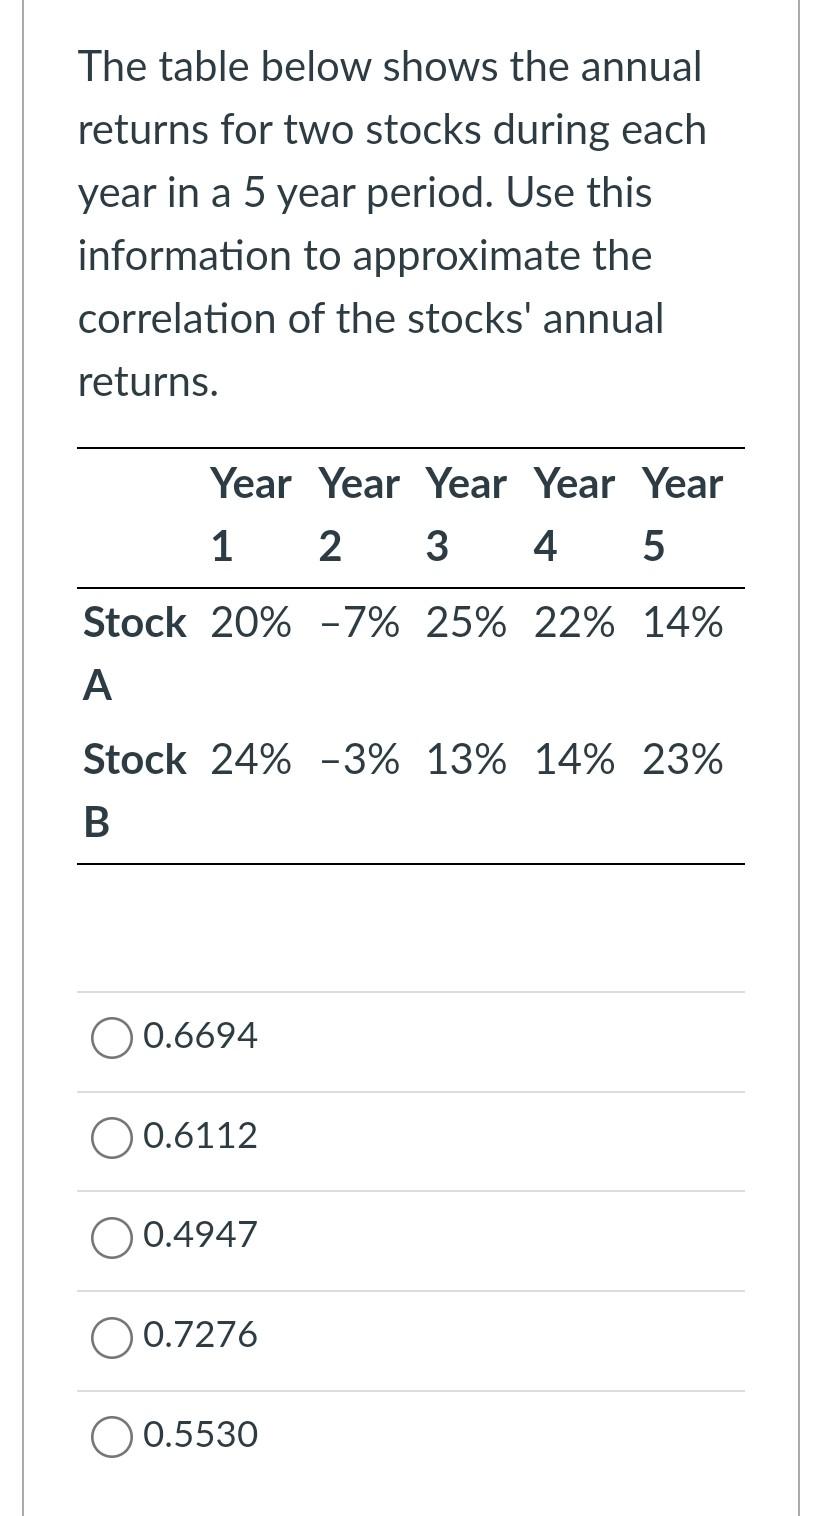
The table below shows the annual returns for two stocks during each year in a 5 year period. Use this information to approximate the correlation of the stocks' annual returns. Year Year Year Year Year 1 2 3 4 5 Stock 20% -7% 25% 22% 14% . Stock 24% -3% 13% 14% 23% B O 0.6694 0.6112 O 0.4947 O 0.7276 0.5530
Step by Step Solution
There are 3 Steps involved in it
1 Expert Approved Answer
Step: 1 Unlock

Question Has Been Solved by an Expert!
Get step-by-step solutions from verified subject matter experts
Step: 2 Unlock
Step: 3 Unlock