

Question: The table below shows the average monthly return, standard deviation, reward to risk ratio, annualized return and annualized standard deviation for six regions (developed, emerging,
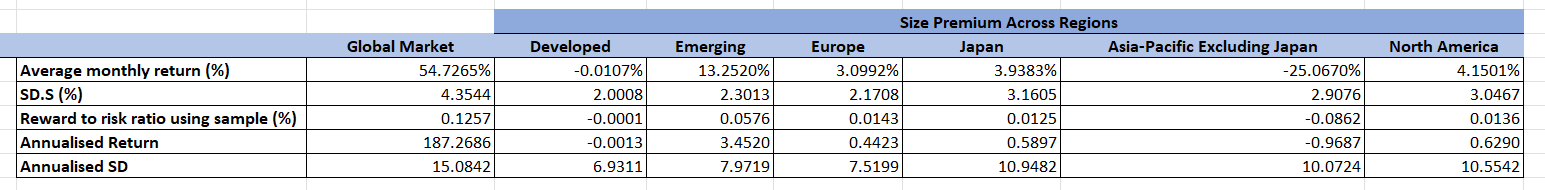
The table below shows the average monthly return, standard deviation, reward to risk ratio, annualized return and annualized standard deviation for six regions (developed, emerging, Europe, Japan, Asia Pacific excluding Japan and North America) that has been analyzed for the past 10 years. The data for global market is given above as well to answer the following question.
 Question:
i). Compare the performance of these size premiums with the global market premium based on the table above. Do they outperform or underperform the market?
ii). On another note, do size matters in investment strategy?
Global Market 54.7265% 4.3544 Average monthly return (%) SD.s (%) Reward to risk ratio using sample (%) Annualised Return Annualised SD Developed -0.0107% 2.0008 -0.0001 -0.0013 6.9311 Emerging 13.2520% 2.3013 0.0576 3.4520 7.9719 Size Premium Across Regions Europe Japan Asia-Pacific Excluding Japan 3.0992% 3.9383% -25.0670% 2.1708 3.1605 2.9076 0.0143 0.0125 -0.0862 0.4423 0.5897 -0.9687 7.5199 10.9482 10.0724 North America 4.1501% 3.0467 0.0136 0.6290 10.5542 0.1257 187.2686 15.0842 Global Market 54.7265% 4.3544 Average monthly return (%) SD.s (%) Reward to risk ratio using sample (%) Annualised Return Annualised SD Developed -0.0107% 2.0008 -0.0001 -0.0013 6.9311 Emerging 13.2520% 2.3013 0.0576 3.4520 7.9719 Size Premium Across Regions Europe Japan Asia-Pacific Excluding Japan 3.0992% 3.9383% -25.0670% 2.1708 3.1605 2.9076 0.0143 0.0125 -0.0862 0.4423 0.5897 -0.9687 7.5199 10.9482 10.0724 North America 4.1501% 3.0467 0.0136 0.6290 10.5542 0.1257 187.2686 15.0842
Step by Step Solution
There are 3 Steps involved in it

Get step-by-step solutions from verified subject matter experts