

Question: The table below shows the cash flows for two projects A and B over its useful life of 6 years. Evaluate the projects using a)
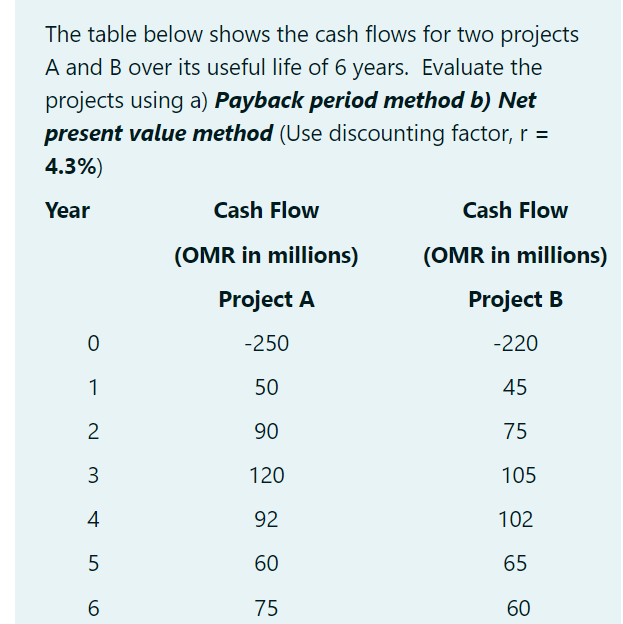
The table below shows the cash flows for two projects A and B over its useful life of 6 years. Evaluate the projects using a) Payback period method b) Net present value method (Use discounting factor, r = 4.3%) Year Cash Flow Cash Flow (OMR in millions) (OMR in millions) Project A Project B 0 -250 -220 1 50 45 2 90 75 3 120 105 4. 92 102 5 60 65 6 75 60
Step by Step Solution
There are 3 Steps involved in it
1 Expert Approved Answer
Step: 1 Unlock

Question Has Been Solved by an Expert!
Get step-by-step solutions from verified subject matter experts
Step: 2 Unlock
Step: 3 Unlock