

Question: The table below shows the conditional distributions of the variable blood type for men and for women for a certain population. Interpret the number in
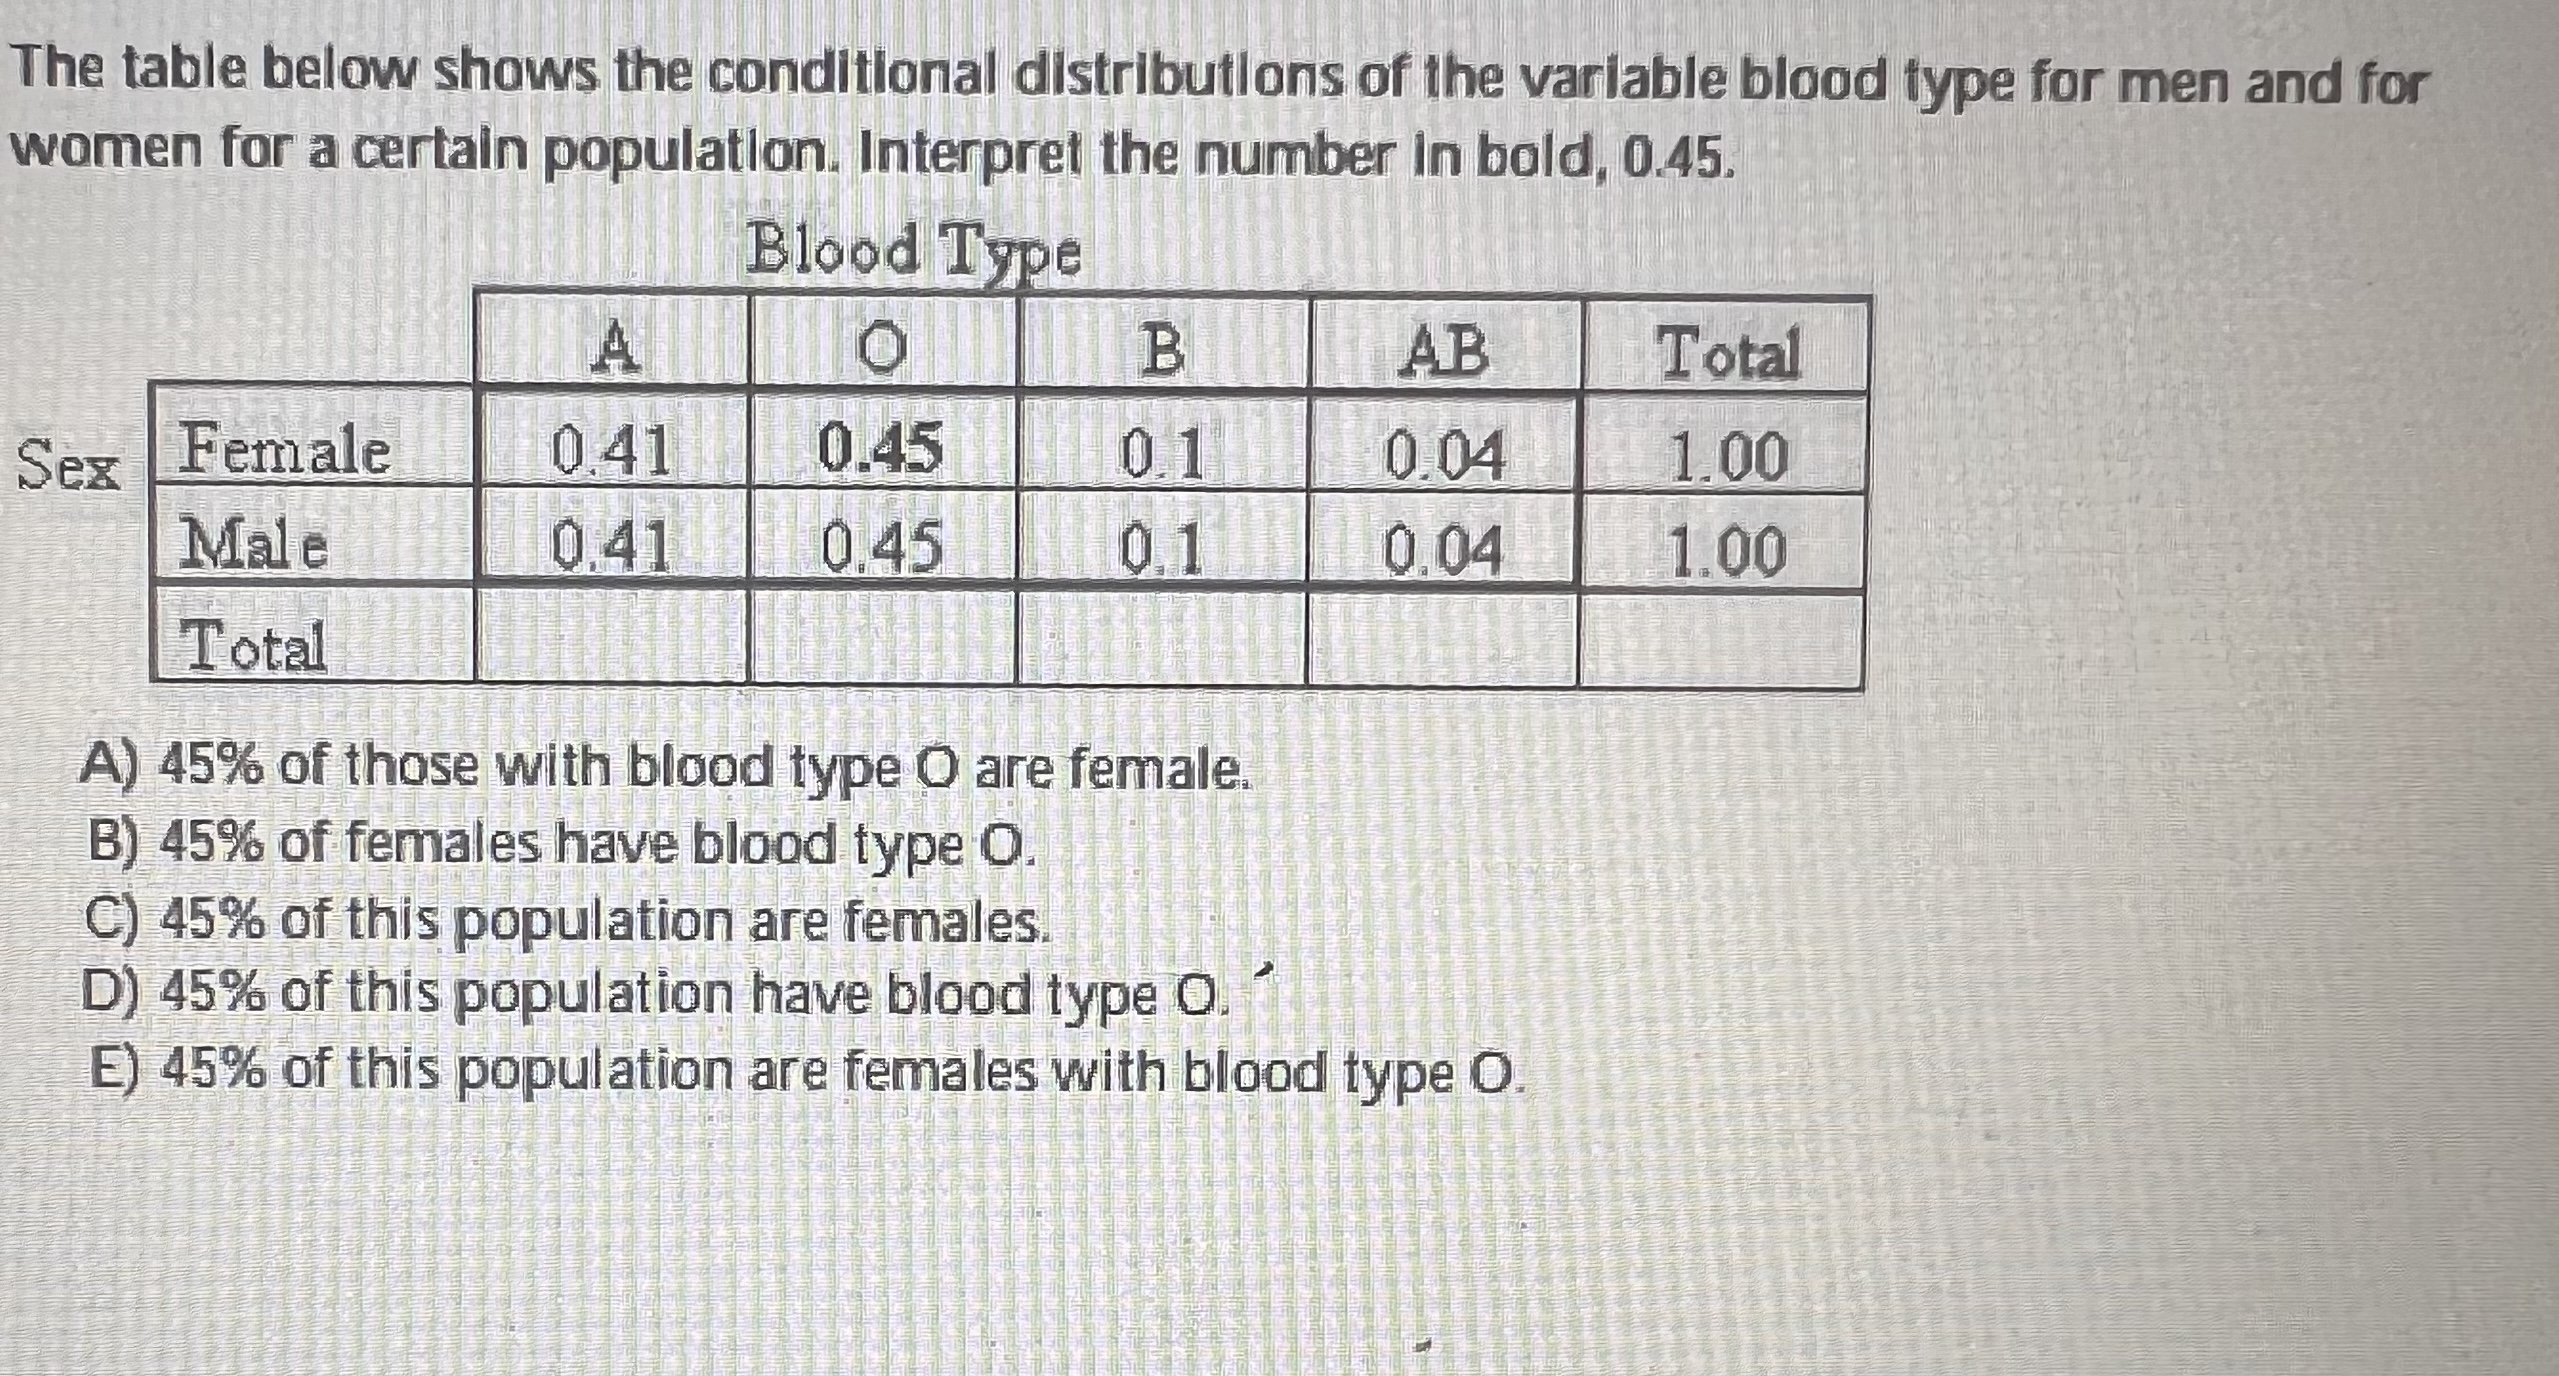
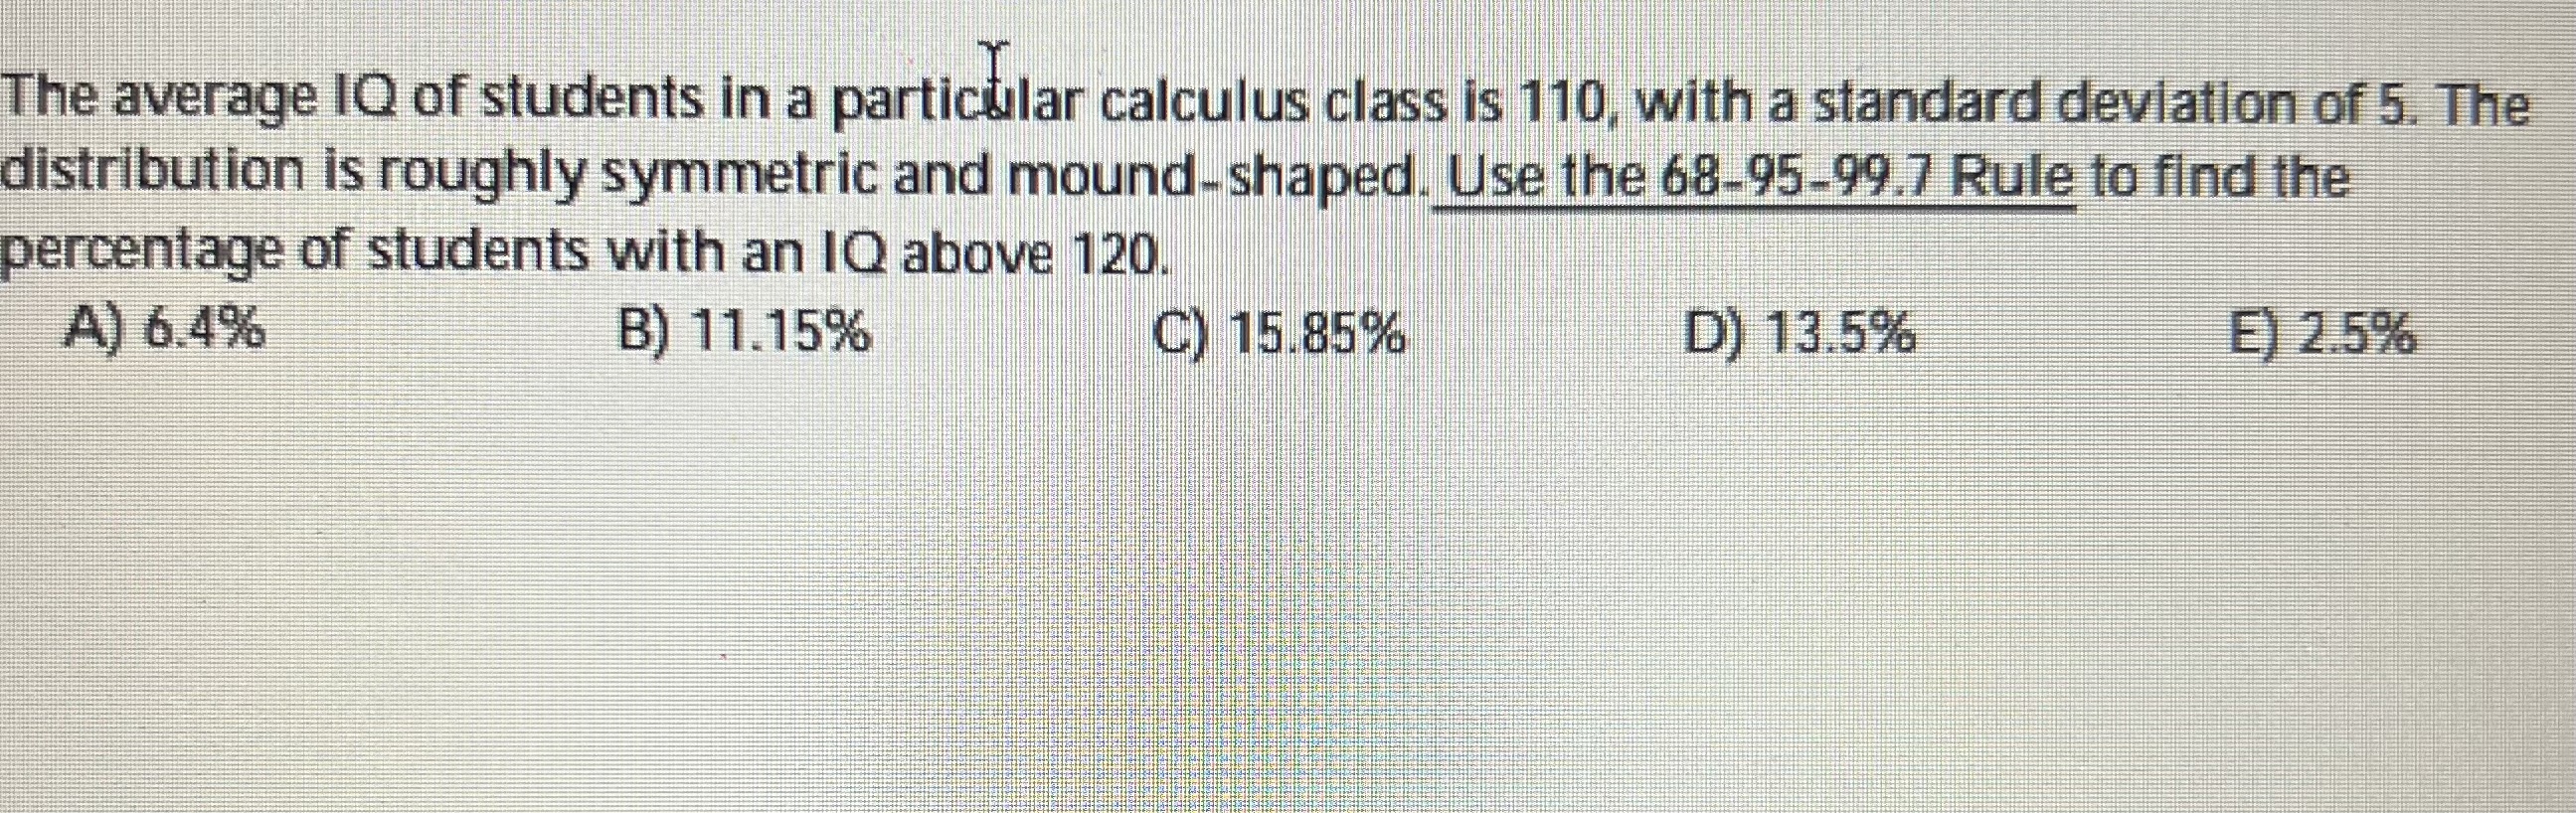
The table below shows the conditional distributions of the variable blood type for men and for women for a certain population. Interpret the number in bold, 0.45. Blood Type A O B AB Total Sex Female 0.41 0.45 0.1 0.04 1.00 Male 0.41 0.45 0.1 0.04 1.00 Total A) 45% of those with blood type O are female. B) 45% of females have blood type O. C) 45% of this population are females D) 45% of this population have blood type O. " E) 45% of this population are females with blood type O.The average IQ of students in a particular calculus class is 110, with a standard deviation of 5. The distribution is roughly symmetric and mound-shaped. Use the 68-95-99.7 Rule to find the percentage of students with an IQ above 120. A) 6.4% B) 11.15% C) 15.85% D) 13.5% E) 2.5%
Step by Step Solution
There are 3 Steps involved in it

Get step-by-step solutions from verified subject matter experts