

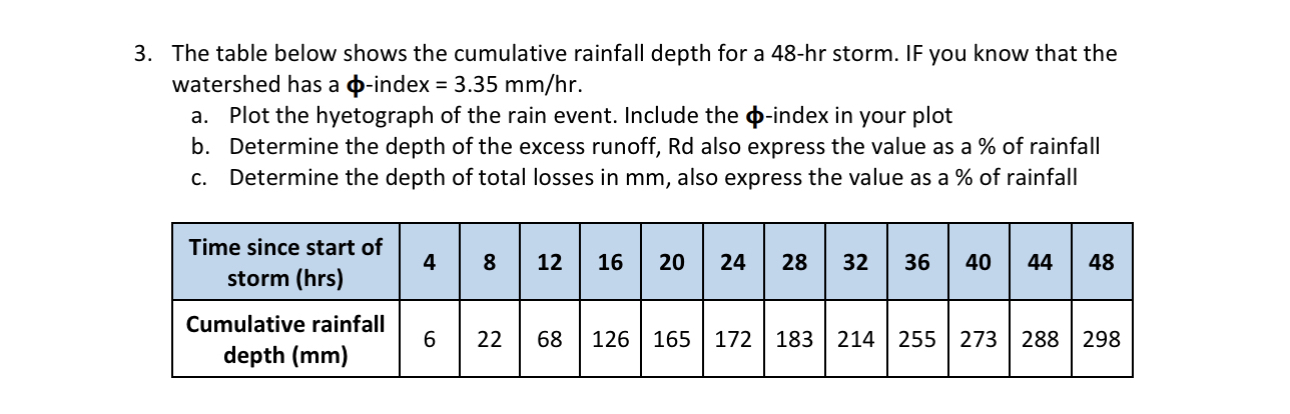
Question: The table below shows the cumulative rainfall depth for a 4 8 - h r storm. IF you know that the watershed has a -
The table below shows the cumulative rainfall depth for a storm. IF you know that the watershed has a index
a Plot the hyetograph of the rain event. Include the index in your plot
b Determine the depth of the excess runoff, Rd also express the value as a of rainfall
c Determine the depth of total losses in also express the value as a of rainfall
tabletableTime since start ofstorm hrs
Step by Step Solution
There are 3 Steps involved in it
1 Expert Approved Answer
Step: 1 Unlock

Question Has Been Solved by an Expert!
Get step-by-step solutions from verified subject matter experts
Step: 2 Unlock
Step: 3 Unlock