

Question: The table below shows the demand schedule for a particular good. Price (dollars per unit) 250 200 150 Quantity Demanded (units) 0 40 80 100
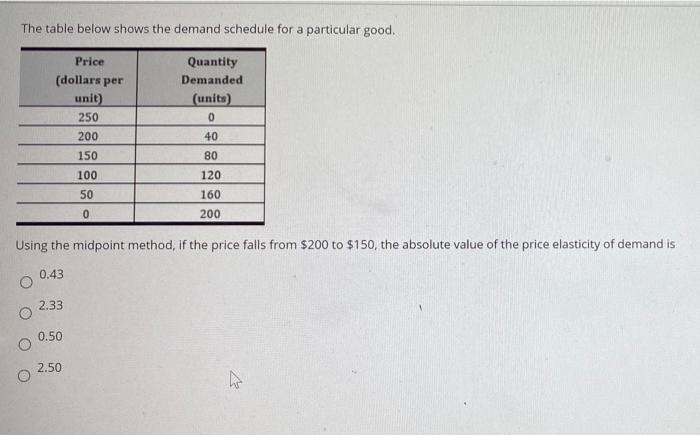
The table below shows the demand schedule for a particular good. Price (dollars per unit) 250 200 150 Quantity Demanded (units) 0 40 80 100 120 50 160 0 200 Using the midpoint method, if the price falls from $200 to $150, the absolute value of the price elasticity of demand is 0.43 2.33 0.50 2.50 27
Step by Step Solution
There are 3 Steps involved in it
1 Expert Approved Answer
Step: 1 Unlock

Question Has Been Solved by an Expert!
Get step-by-step solutions from verified subject matter experts
Step: 2 Unlock
Step: 3 Unlock