

+ The table below shows the frequency distribution of the weights (in grams) of pre-1964 quarters....
Fantastic news! We've Found the answer you've been seeking!
Question:
Transcribed Image Text:
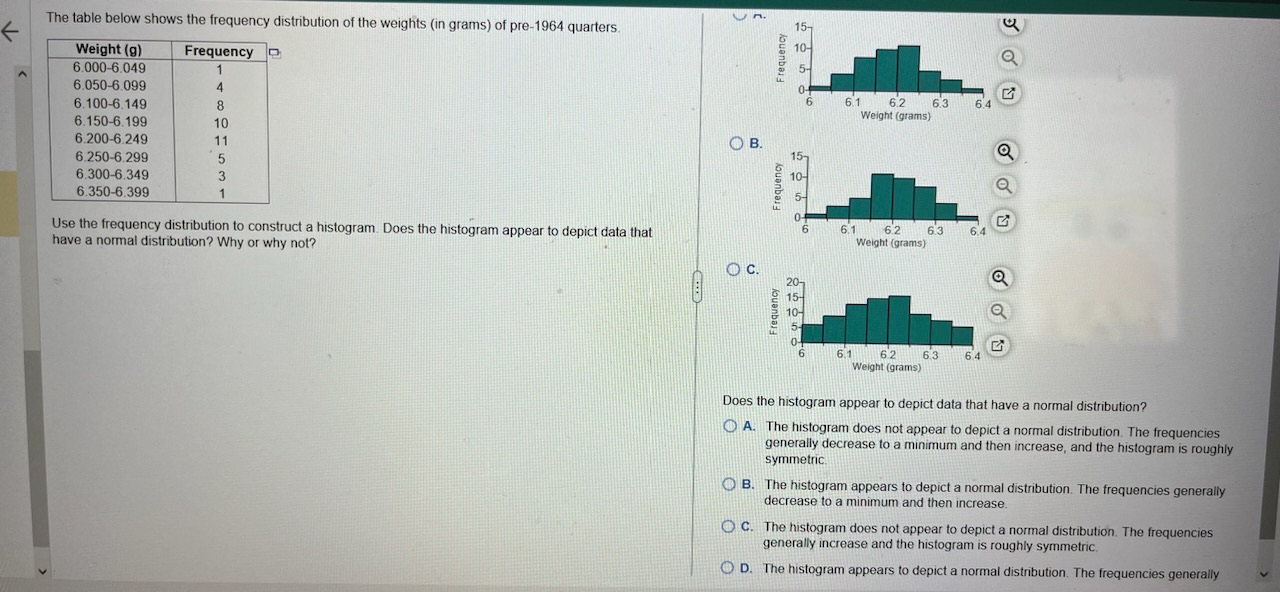
+ The table below shows the frequency distribution of the weights (in grams) of pre-1964 quarters. Weight (g) 6.000-6.049 Frequency 6.050-6.099 6.100-6.149 8 6.150-6.199 10 6.200-6.249 11 6.250-6.299 5 6.300-6.349 3 6.350-6.399 1 Use the frequency distribution to construct a histogram. Does the histogram appear to depict data that have a normal distribution? Why or why not? OB. Frequency Frequency 15- OC. 20- Frequency 15- 10- 6 6.1 6.2 Weight (grams) 6 6.2 6.1 Weight (grams) 6.3 6.4 6.3 6.4 G 6 6.1 6.2 Weight (grams) 6.3 6.4 Q Does the histogram appear to depict data that have a normal distribution? OA. The histogram does not appear to depict a normal distribution. The frequencies generally decrease to a minimum and then increase, and the histogram is roughly symmetric B. The histogram appears to depict a normal distribution. The frequencies generally decrease to a minimum and then increase. OC. The histogram does not appear to depict a normal distribution. The frequencies generally increase and the histogram is roughly symmetric. OD. The histogram appears to depict a normal distribution. The frequencies generally + The table below shows the frequency distribution of the weights (in grams) of pre-1964 quarters. Weight (g) 6.000-6.049 Frequency 6.050-6.099 6.100-6.149 8 6.150-6.199 10 6.200-6.249 11 6.250-6.299 5 6.300-6.349 3 6.350-6.399 1 Use the frequency distribution to construct a histogram. Does the histogram appear to depict data that have a normal distribution? Why or why not? OB. Frequency Frequency 15- OC. 20- Frequency 15- 10- 6 6.1 6.2 Weight (grams) 6 6.2 6.1 Weight (grams) 6.3 6.4 6.3 6.4 G 6 6.1 6.2 Weight (grams) 6.3 6.4 Q Does the histogram appear to depict data that have a normal distribution? OA. The histogram does not appear to depict a normal distribution. The frequencies generally decrease to a minimum and then increase, and the histogram is roughly symmetric B. The histogram appears to depict a normal distribution. The frequencies generally decrease to a minimum and then increase. OC. The histogram does not appear to depict a normal distribution. The frequencies generally increase and the histogram is roughly symmetric. OD. The histogram appears to depict a normal distribution. The frequencies generally
Expert Answer:

Posted Date:
Students also viewed these mathematics questions
-
What is inflation? A ) A decrease in the general price level B ) An increase in the general price level C ) A decrease in the money supply D ) An increase in the money supply Don't use chatgpt...
-
Which player had a higher opportunity cost in terms of offensive production for the Red Sox? A. Dutch Leonard B. Bill James C. Tilly Walker D. Babe Ruth
-
2022 Full Year Results Strong sales growth and continued progress against strategy Underlying performance GAAP measures (unaudited) 2022 vs 2021 2022 vs 2021 Full Year Underlying sales growth (USG)...
-
The Electronic Industries Association reports that about 50% of U.S. households have a camcorder. For a randomly selected sample of 800 U.S. households, use the normal approximation to the binomial...
-
The data presented in Table suggest that the corporate form suffered a tax disadvantage relative to the partnership form from 1987 to 1992. List and explain the factors that caused this outcome. Why...
-
Consider the surface generated by revolving a line connecting two fixed points (x1, y1) and (x2, y2) about an axis coplanar with the two points, Find the equation of the line connecting the points...
-
Economics is concerned with a. the choices people must make because resources are scarce. b. human decision makers and the factors that influence their choices. c. the allocation of limited resources...
-
An investor buys a stock for $36. At the same time a six-month put option to sell the stock for $35 is selling for $2. a) What is the profit or loss from purchasing the stock if the price of the...
-
Saved Henry Gustav Molaison (HM) had his hippocampus removed. Though he lost the ability to form new memories, he was still capable of forming new memories A) sensory, short-term B) implicit;...
-
Assume A Corp, B Corp, and C Corp are components of the Dow Jones Industrial Average (DJIA). Given the information below, which would have the most influence on price movements of the DJIA? B Corp.:...
-
You are given the cost of an item before and after tax. Find the amount of tax and the tax rate. Round both solutions to two decimal places, if necessary. Cost of item: $76 Selling price: $90.52 Tax...
-
Solve the following circuit for all values of resistance, current, and voltage. (Note: Leave all answers as whole numbers. Do NOT use SigFigs for this question. Da NOT include any units.) VT www R1...
-
You should turn in areport(.pdf is preferred) that: Demonstrates clearly that you completed the assignment. This may include: 1.A coverage report from the coverage tool you used. 2.A (tool-generated)...
-
What are the two quality management tools or strategies used in the health care industry? Also describe briefly their importance in the industry.
-
(a) Consider the following schema: Purchase (Custname, amount, date, time) where Custname, amount, date, time, and price are character strings of length 15, integers of 2 bytes, 7 byte date type, and...
-
Provide a brief introduction to the overall hospitality property (taj hotel in cape town). (5 marks )
-
Show that the block upper triangular matrix A in Example 5 is invertible if and only if both A 11 and A 22 are invertible. Data from in Example 5 EXAMPLE 5 A matrix of the form A = [ A11 A12 0 A22 is...
-
Where in the goal setting process did DSW need to bring in its team members to ensure achievement of the goals?
-
What does DSW need to recognize as the most important element(s) in actually meeting the new fiscal year goals?
-
To meet the annual customer price reductions, what can DSW do to reduce its cost structure?

Study smarter with the SolutionInn App