

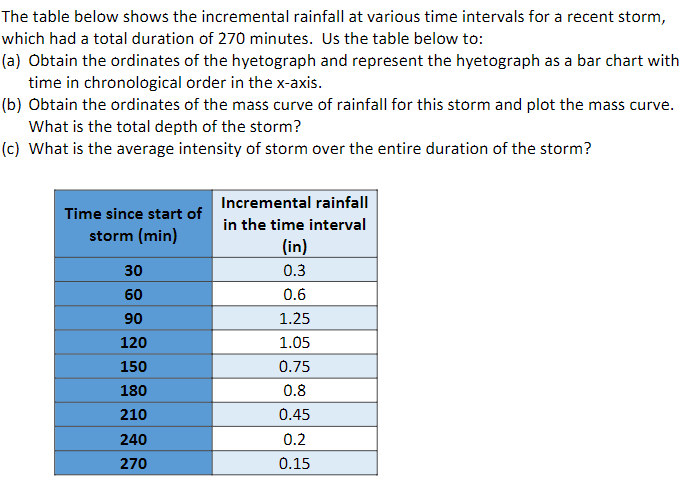
Question: The table below shows the incremental rainfall at various time intervals for a recent storm, which had a total duration of 2 7 0 minutes.
The table below shows the incremental rainfall at various time intervals for a recent storm,
which had a total duration of minutes. Us the table below to:
a Obtain the ordinates of the hyetograph and represent the hyetograph as a bar chart with
time in chronological order in the axis.
b Obtain the ordinates of the mass curve of rainfall for this storm and plot the mass curve.
What is the total depth of the storm?
c What is the average intensity of storm over the entire duration of the storm?
Step by Step Solution
There are 3 Steps involved in it
1 Expert Approved Answer
Step: 1 Unlock

Question Has Been Solved by an Expert!
Get step-by-step solutions from verified subject matter experts
Step: 2 Unlock
Step: 3 Unlock