

Question: The table below shows the number of visitors to a museum over a period of 5 days. Monday Tuesday Wednesday Thursday Children 120 110
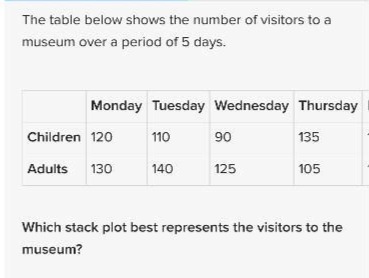
The table below shows the number of visitors to a museum over a period of 5 days. Monday Tuesday Wednesday Thursday Children 120 110 90 135 Adults 130 140 125 105 Which stack plot best represents the visitors to the museum?
Step by Step Solution
There are 3 Steps involved in it
1 Expert Approved Answer
Step: 1 Unlock

To determine which stack plot best represents the visitors to the museum we need to calculate the to... View full answer
Question Has Been Solved by an Expert!
Get step-by-step solutions from verified subject matter experts
Step: 2 Unlock
Step: 3 Unlock