

Question: The table below shows the payoff matrix for a game between Toyota and Honda, each of which is contemplating building a factory in a new
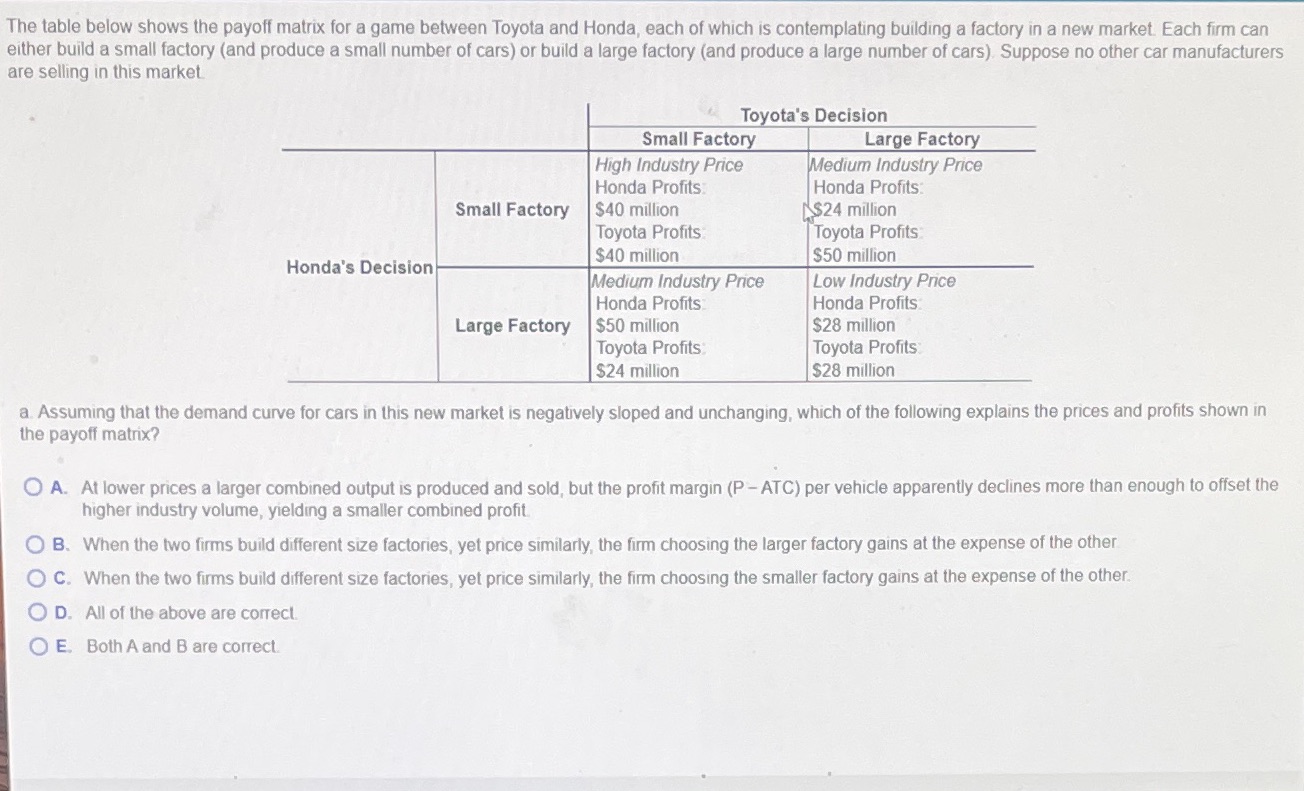
The table below shows the payoff matrix for a game between Toyota and Honda, each of which is contemplating building a factory in a new market. Each firm can either build a small factory (and produce a small number of cars) or build a large factory (and produce a large number of cars). Suppose no other car manufacturers are selling in this market Toyota's Decision Small Factory Large Factory High Industry Price Medium Industry Price Honda Profits Honda Profits Small Factory $40 million $24 million Toyota Profits Toyota Profits $40 million $50 million Honda's Decision Medium Industry Price Low Industry Price Honda Profits Honda Profits Large Factory $50 million $28 million Toyota Profits Toyota Profits $24 million $28 million a. Assuming that the demand curve for cars in this new market is negatively sloped and unchanging, which of the following explains the prices and profits shown in the payoff matrix? O A. At lower prices a larger combined output is produced and sold, but the profit margin (P - ATC) per vehicle apparently declines more than enough to offset the higher industry volume, yielding a smaller combined profit. O B. When the two firms build different size factories, yet price similarly, the firm choosing the larger factory gains at the expense of the other O C. When the two firms build different size factories, yet price similarly, the firm choosing the smaller factory gains at the expense of the other. O D. All of the above are correct. O E. Both A and B are correct
Step by Step Solution
There are 3 Steps involved in it

Get step-by-step solutions from verified subject matter experts