

Question: The table below shows the price and quantity data for a basket of products used in calculating a hypothetical economy's Consumer Price Index (CPI). Year

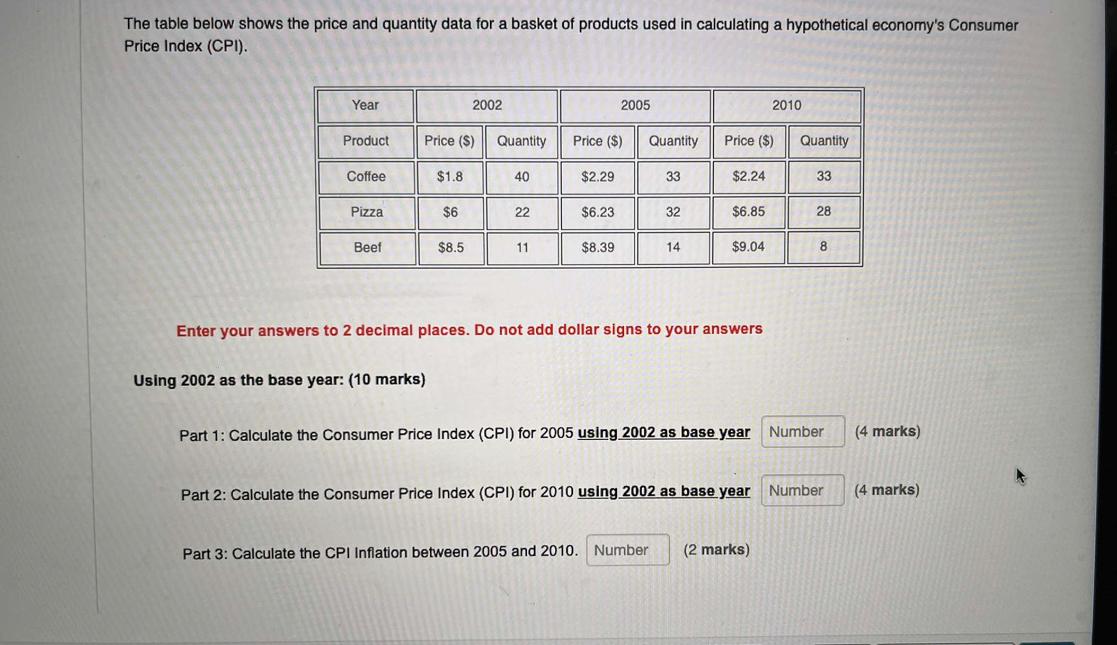
The table below shows the price and quantity data for a basket of products used in calculating a hypothetical economy's Consumer Price Index (CPI). Year 2002 2005 2010 Product Price ($) Quantity Price ($) Quantity Price ($) Quantity Coffee $1.8 40 $2.29 33 $2.24 33 Pizza $6 22 $6.23 32 $6.85 28 Beef $8.5 11 $8.39 14 $9.04 8 Enter your answers to 2 decimal places. Do not add dollar signs to your answers Using 2002 as the base year: (10 marks) Part 1: Calculate the Consumer Price Index (CPI) for 2005 using 2002 as base year Number (4 marks) Part 2: Calculate the Consumer Price Index (CPI) for 2010 using 2002 as base year Number (4 marks) Part 3: Calculate the CPI Inflation between 2005 and 2010. Number (2 marks)
Step by Step Solution
There are 3 Steps involved in it

Get step-by-step solutions from verified subject matter experts