

Question: The table below shows the respective probabilities that a number of power failures will strike a certain subdivision in any given year with mean E
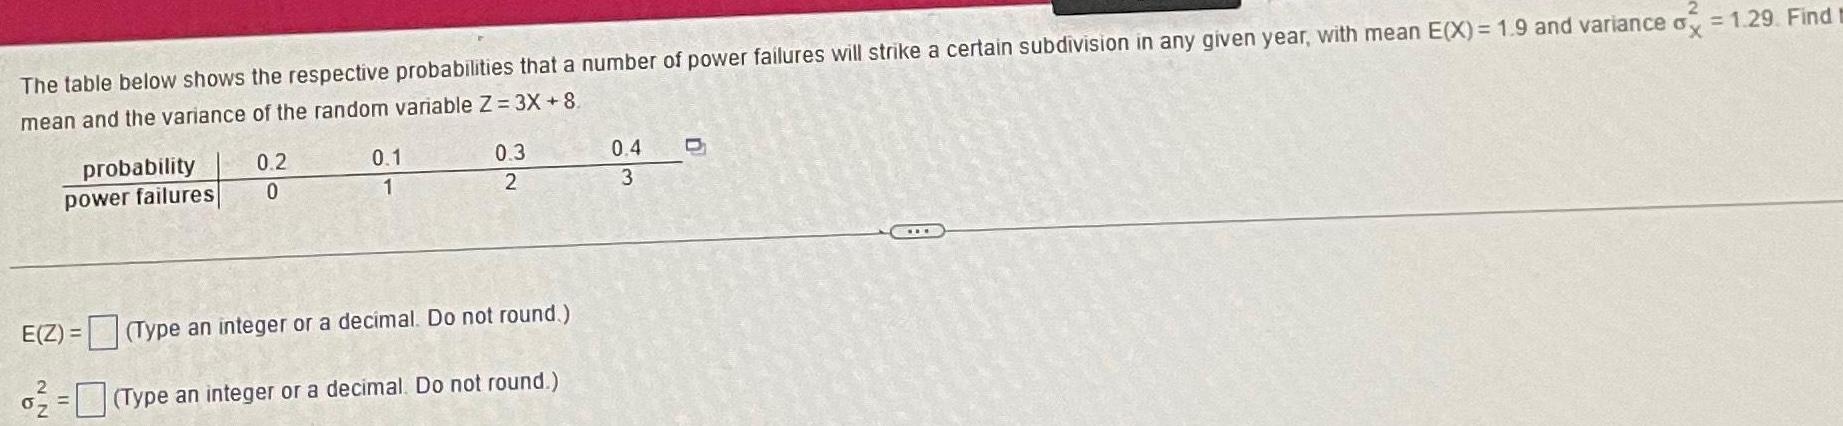

The table below shows the respective probabilities that a number of power failures will strike a certain subdivision in any given year with mean E X 1 9 and variance mean and the variance of the random variable Z 3X 8 probability power failures 0 2 0 0 1 1 0 3 2 E Z Type an integer or a decimal Do not round o2 Type an integer or a decimal Do not round 0 4 3 ox 1 29 Find
Step by Step Solution
There are 3 Steps involved in it
1 Expert Approved Answer
Step: 1 Unlock

Question Has Been Solved by an Expert!
Get step-by-step solutions from verified subject matter experts
Step: 2 Unlock
Step: 3 Unlock