

Question: The table below shows the responses from a sample of 680 people in the General Social Survey to the question, Do you sometimes drink
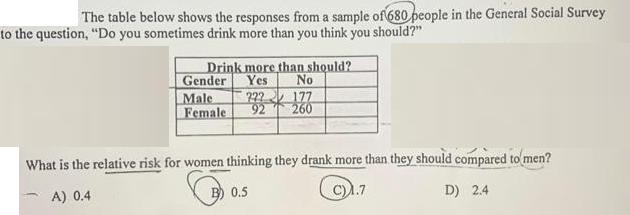
The table below shows the responses from a sample of 680 people in the General Social Survey to the question, "Do you sometimes drink more than you think you should?" Drink more than should? No Gender Yes Male 222 177 Female 92 260 What is the relative risk for women thinking they drank more than they should compared to men? A) 0.4 B) 0.5 C)1.7 D) 2.4
Step by Step Solution
★★★★★
3.41 Rating (164 Votes )
There are 3 Steps involved in it
1 Expert Approved Answer
Step: 1 Unlock

The detailed ... View full answer
Question Has Been Solved by an Expert!
Get step-by-step solutions from verified subject matter experts
Step: 2 Unlock
Step: 3 Unlock