

Question: The table below shows the room occupancy plan for the existing system. Each row in the table follows the patients who checked in on a
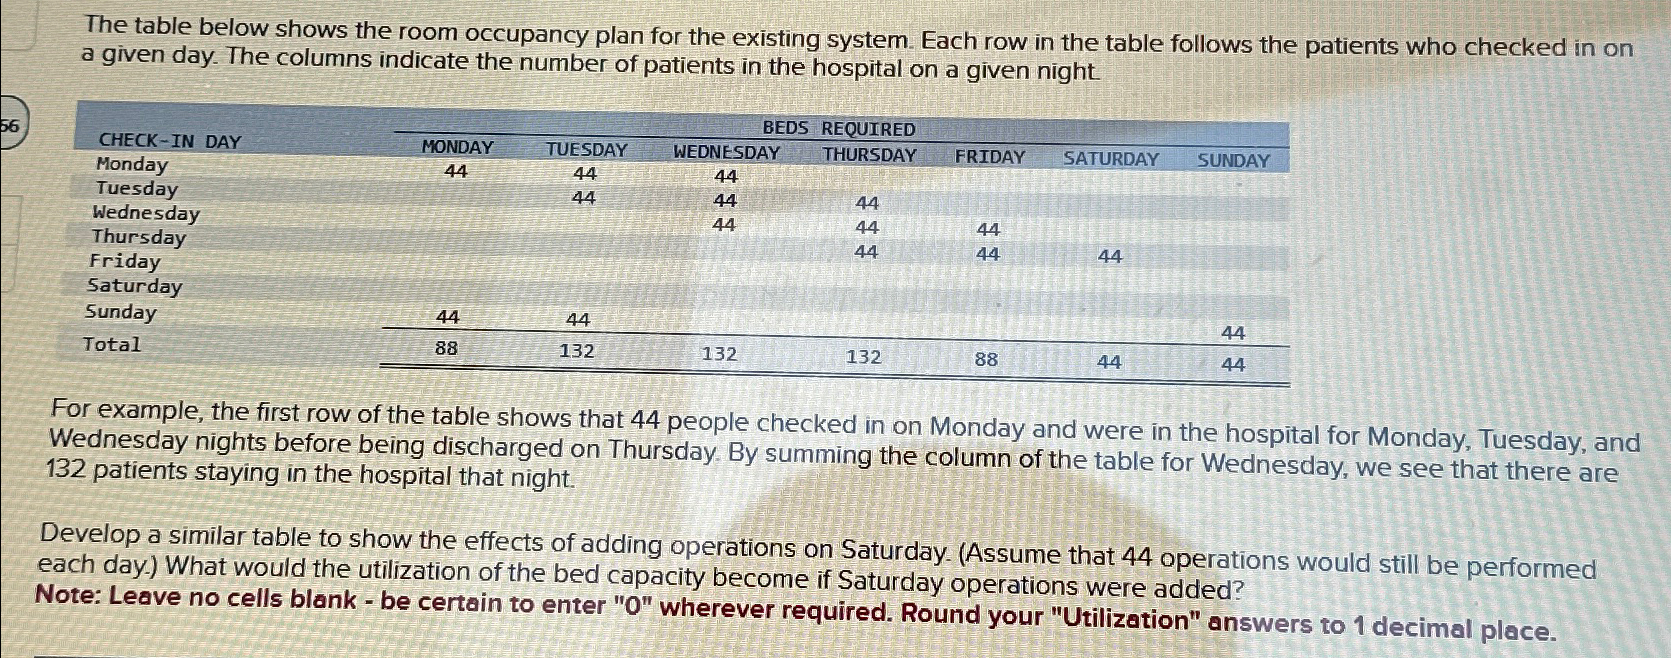
The table below shows the room occupancy plan for the existing system. Each row in the table follows the patients who checked in on a given day. The columns indicate the number of patients in the hospital on a given night
tableBED,REQUIRED,,,CHECK IN DAY,MONDAY,TUESDAY,WEDNESDAY,THURSDAY,FRIDAY,SATURDAY,SUNDAYMondayTuesdayWednesdayThursdaytableFridaySaturdaySundayTotal
For example, the first row of the table shows that people checked in on Monday and were in the hospital for Monday, Tuesday, and Wednesday nights before being discharged on Thursday. By summing the column of the table for Wednesday, we see that there are patients staying in the hospital that night.
Develop a similar table to show the effects of adding operations on Saturday. Assume that operations would still be performed each day. What would the utilization of the bed capacity become if Saturday operations were added?
Note: Leave no cells blank be certain to enter wherever required. Round your "Utilization" answers to decimal place.
Step by Step Solution
There are 3 Steps involved in it
1 Expert Approved Answer
Step: 1 Unlock

Question Has Been Solved by an Expert!
Get step-by-step solutions from verified subject matter experts
Step: 2 Unlock
Step: 3 Unlock