

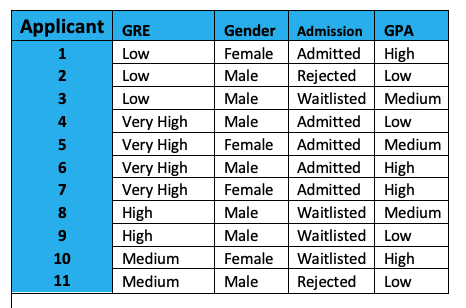
Question: The table below shows whether an applicant has been rejected, waitlisted, or admitted to a college. There are three predictors. All variables have been categorized
The table below shows whether an applicant has been rejected, waitlisted, or admitted to a college. There are three predictors. All variableshave been categorized into categorical variables.
Use Excel and the CART methodology to develop a classification model for the following training data one level only:
Applicant
GRE
Gender
Admission
GPA
Low
Female
Admitted
High
Low
Male
Rejected
Low
Low
Male
Waitlisted
Medium
Very High
Male
Admitted
Low
Very High
Female
Admitted
Medium
Very High
Male
Admitted
High
Very High
Female
Admitted
High
High
Male
Waitlisted
Medium
High
Male
Waitlisted
Low
Medium
Female
Waitlisted
High
Medium
Male
Rejected
Low begintabularcllll
hline Applicant & GRE & Gender & Admission & GPA
hline multirowmathbf & Low & Female & Admitted & High
cline mathbf & Low & Male & Rejected & Low
cline mathbf & Low & Male & Waitlisted & Medium
cline mathbf & Very High & Male & Admitted & Low
cline mathbf & Very High & Female & Admitted & Medium
cline mathbf & Very High & Male & Admitted & High
cline mathbf & Very High & Female & Admitted & High
cline mathbf & High & Male & Waitlisted & Medium
cline mathbf & High & Male & Waitlisted & Low
cline mathbf & Medium & Female & Waitlisted & High
cline mathbf & Medium & Male & Rejected & Low
hline
endtabular
Step by Step Solution
There are 3 Steps involved in it
1 Expert Approved Answer
Step: 1 Unlock

Question Has Been Solved by an Expert!
Get step-by-step solutions from verified subject matter experts
Step: 2 Unlock
Step: 3 Unlock