

Question: The table below shows x-bar and s for 24 samples for a new production process. x-bar and s are calculated from samples n=4. Since
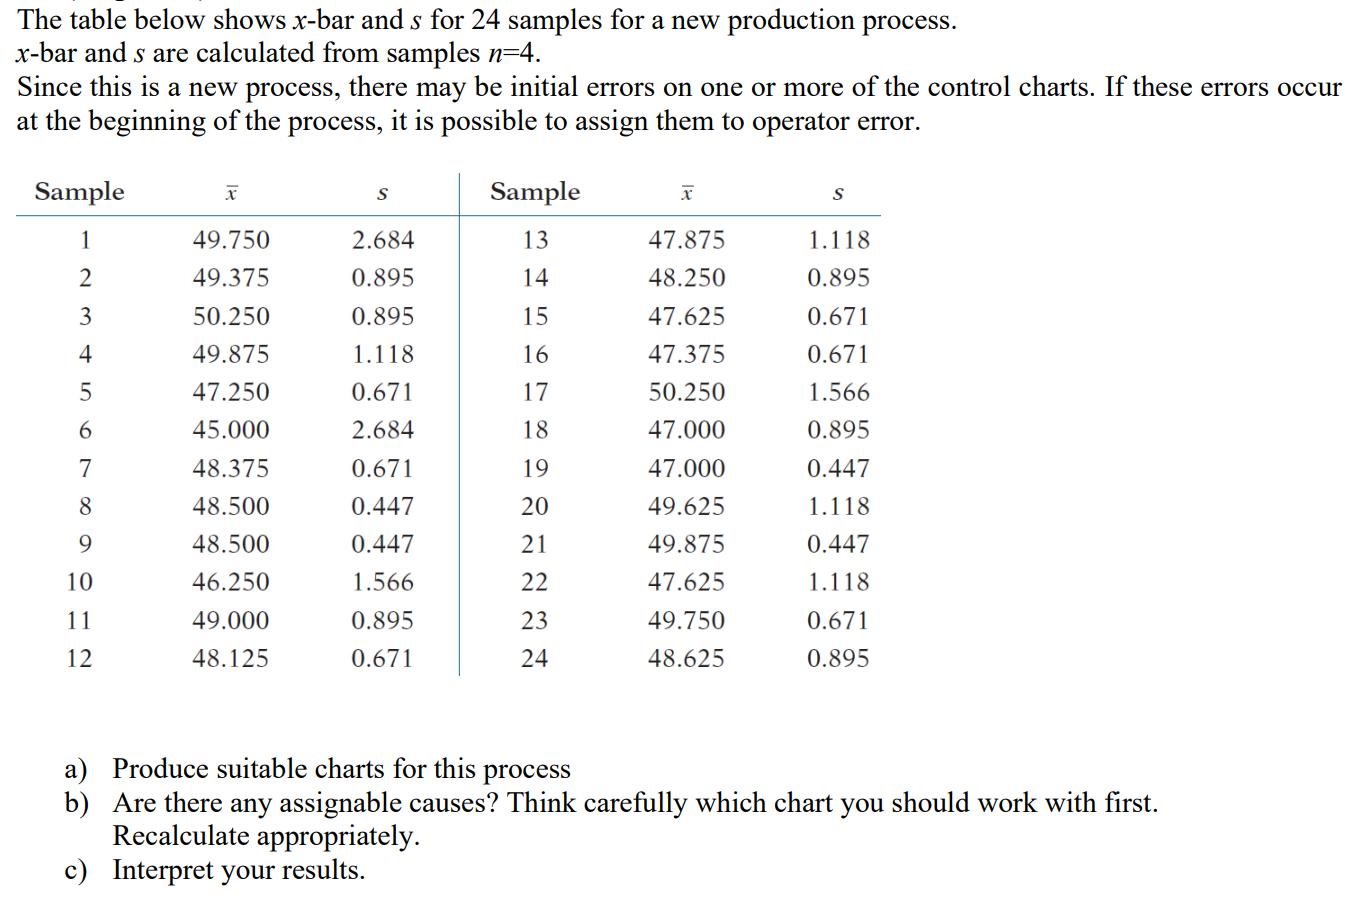
The table below shows x-bar and s for 24 samples for a new production process. x-bar and s are calculated from samples n=4. Since this is a new process, there may be initial errors on one or more of the control charts. If these errors occur at the beginning of the process, it is possible to assign them to operator error. Sample Sample S 1 49.750 2.684 13 47.875 1.118 49.375 0.895 14 48.250 0.895 3 50.250 0.895 15 47.625 0.671 4 49.875 1.118 16 47.375 0.671 47.250 0.671 17 50.250 1.566 6. 45.000 2.684 18 47.000 0.895 7 48.375 0.671 19 47.000 0.447 8 48.500 0.447 20 49.625 1.118 9. 48.500 0.447 21 49.875 0.447 10 46.250 1.566 22 47.625 1.118 11 49.000 0.895 23 49.750 0.671 12 48.125 0.671 24 48.625 0.895 a) Produce suitable charts for this b) Are there any assignable causes? Think carefully which chart you should work with first. Recalculate appropriately. c) Interpret your results. process
Step by Step Solution
3.57 Rating (154 Votes )
There are 3 Steps involved in it
a Contral chart X EX 24 for 11 61 125 24 ... View full answer

Get step-by-step solutions from verified subject matter experts