

Question: The table below specifies the X-bar and R values for 24 samples, each of which is 5 in size, from a process. a) Create X-bar
The table below specifies the X-bar and R values for 24 samples, each of which is 5 in size, from a process.
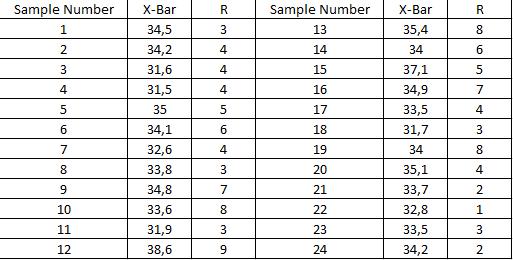
a) Create X-bar and R charts for this process. Indicate whether the process is under control.
b) If the specifications for the product obtained from the process are 30 + - 10, find the proportion of incompatible (non-compliant) products produced by the process under the assumption of normal distribution.
Sample Number X-Bar R Sample Number X-Bar R 1 34,5 3 13 35,4 8. 34,2 4 14 34 6. 31,6 4 15 37,1 4 31,5 4 16 34,9 7 35 17 33,5 4 34,1 6. 18 31,7 7 32,6 19 34 8 8 33,8 20 35,1 4 34,8 7 21 33,7 10 33,6 22 32,8 11 31,9 23 33,5 12 38,6 24 34,2 2.
Step by Step Solution
There are 3 Steps involved in it

Get step-by-step solutions from verified subject matter experts