

Question: The table below summarizes data from a survey of a sample of women. Using a 0.01 significance level, and assuming that the sample sizes of

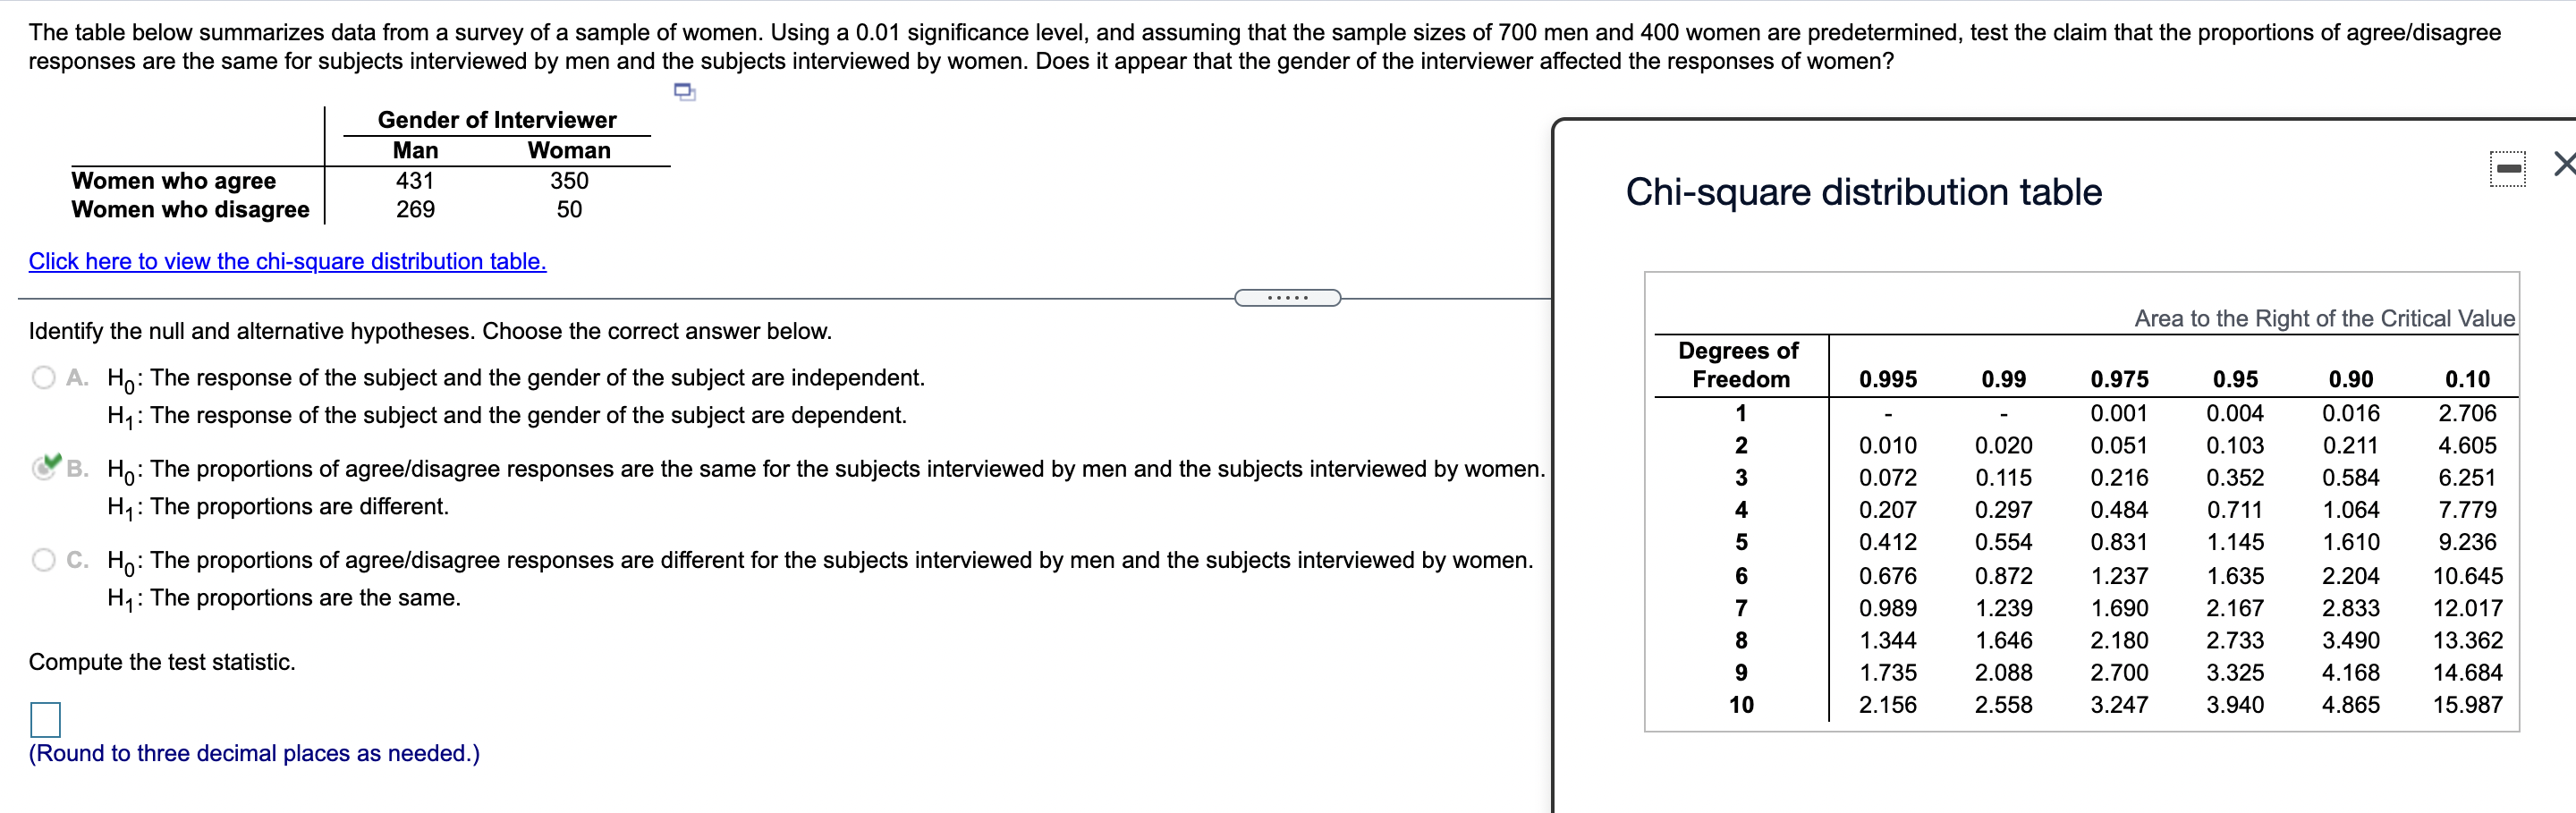
The table below summarizes data from a survey of a sample of women. Using a 0.01 significance level, and assuming that the sample sizes of 700 men and 400 women are predetermined, test the claim that the proportions of agree/disagree responses are the same for subjects interviewed by men and the subjects interviewed by women. Does it appear that the gender of the interviewer affected the responses of women? Gender of Interviewer Man Woman Women who agree 431 350 Women who disagree 269 50 Chi-square distribution table Click here to view the chi-square distribution table. Identify the null and alternative hypotheses. Choose the correct answer below. Area to the Right of the Critical Value Degrees of O A. Ho: The response of the subject and the gender of the subject are independent. Freedom 0.995 0.99 0.975 0.95 0.90 0.10 H1: The response of the subject and the gender of the subject are dependent. 0.001 0.004 0.016 2.706 N 0.010 0.020 0.051 0. 103 0.211 4.605 B. Ho: The proportions of agree/disagree responses are the same for the subjects interviewed by men and the subjects interviewed by women. 0.072 0.115 0.216 0.352 0.584 6.251 H1: The proportions are different. 0.207 0.297 0.484 0.711 1.064 7.779 0.412 0.554 0.831 1.145 1.610 9.236 O C. Ho: The proportions of agree/disagree responses are different for the subjects interviewed by men and the subjects interviewed by women. 0.676 0.872 1.237 1.635 2.204 10.645 H1: The proportions are the same. 0.989 1.239 1.690 2.167 2.833 12.017 1.344 1.646 2.180 2.733 3.490 13.362 Compute the test statistic. 1.735 2.088 2.700 3.325 4.168 14.684 2. 156 2.558 3.247 3.940 4.865 15.987 Round to three decimal places as needed.)
Step by Step Solution
There are 3 Steps involved in it

Get step-by-step solutions from verified subject matter experts